How does my traffic to a site on the Internet get there? What path did it follow?
These are great questions, and I will attempt to answer them in this article.
When you’re on the Internet, information or requests sent from your computer don’t reach the destination computer in a single jump – or hop (unless the destination is in your house or on your LAN). Instead, it takes a number of routers (each one counted as a hop), networked together, to help you receive and transmit information. Your data requests and replies take unique routes along the Internet. Can we see these hops? In most cases, yes. You can already tell this gets complicated.
There is a program called traceroute that accomplishes this. In Windows it is called ‘tracert’ and in just about everything else it is called ‘traceroute’. Let’s start simple and observe these hops.
If you are using Windows, open a CMD (Start> Run> CMD) and enter the following command:
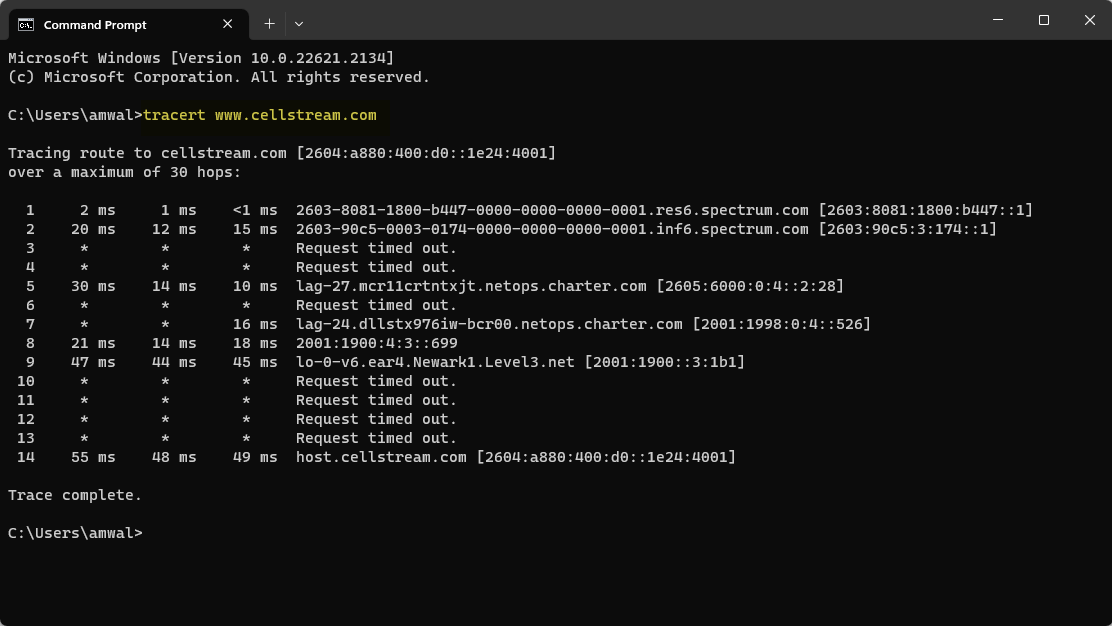
tracert www.cellstream.com
Be patient, it takes time to complete this discovery of the path to CellStream.com. Your output will differ from mine because you are asking your machine to trace the path to the cellstream.com server from your location. Let’s look at what my output says:

The output is a list – in my case 14 hops to get from my location to the cellstream.com server. In my case, IPv6 is used, and whether IPv6 or IPv4 results are shown, it does not matter.
Each router on the traceroute is identified by its IP address, that identifies that device’s unique network connection. In some cases we see asterisks and the notation that the request timed out. These were still hops. Those routers are simply configured to not respond to the traceroute.
Here are a few details regarding a traceroute:
- The journey from one router to another is known as a hop
- The amount of time it takes to make a hop is measured in milliseconds
If you are using Linux or MAC OS, use the following command:
traceroute www.cellstream.com
OK this is all well and good, but what actually happened?
When you ran the traceroute, your system used the Internet Control Message Protocol (ICMP) to send a ping or echo request to the destination. However, it uses a clever trick: it starts by setting the TTL/Hop Limit to 1. The Time To Live (TTL)/Hop Limit counter is always decremented at each router in the Internet as a loop prevention mechanism. If a packet is in a loop between two routers this counter will get to zero and looping packets will be dropped from the network. OK, so by starting with the hope counter at 1, this means that when the IP packet reached the first router/hop, this counter will be decremented to 0, and cause an error response from the router. The router is going to say, hey I am router X, and I dropped your packet before it reached the destination. Ta-Da!! We just learned the first hop.
Now we simply sent the next ping/echo request with the counter set to 2. This will cause the second hop to send us an error message, and ta-da, we just learned the second hop.
All we need to do is keep repeating this process until we eventually reach CellStream.com.
Along the way, we are going to keep track of time (in milliseconds). In fact in Windows, we will see three attempts to measure the max, min and average time it takes for the hop to respond.
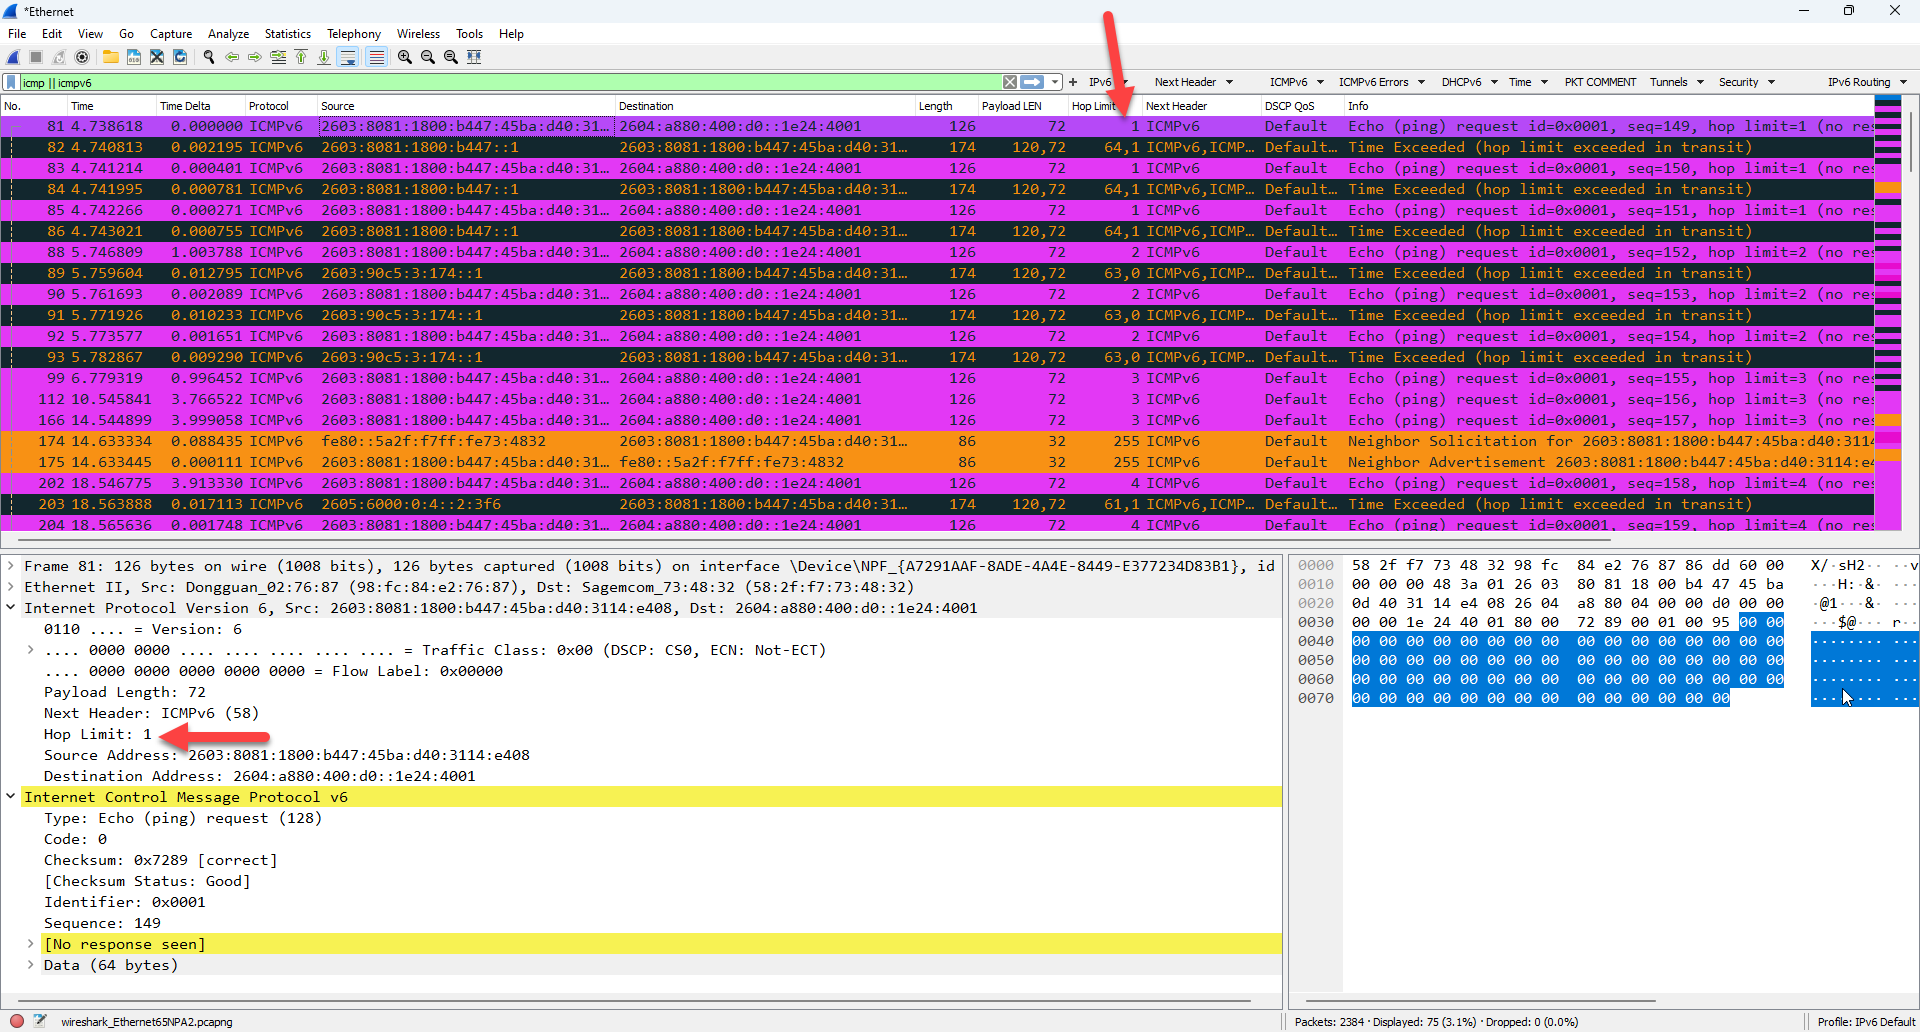
You system To view this, we can do a packet capture of the traceroute process using Wireshark. Here are the results:

The first packet of the process is shown with the hop limit set to 1. Looking at the hop limit column we see three 1’s, then three 2’s, etc. We also see the ICMP errors in orange and black.
When no errors are received, that is when we get the asterisks for the timing and ‘request timed out’.
If you wanted to try this yourself, use the following filter in Wireshark to display the traceroute traffic:
(icmp || icmpv6) && (icmp.type ==128 ||icmpv6.type == 128) || (icmp.type==129 || icmpv6.type ==129)
Will the Traceroute path always be the same?
Great question. It may not. The reason is that there are usually multiple paths in the Internet. Your traffic will 100% of the time follow the “least cost” path. But there may be equal cost paths. You can read more on this in my article: https://www.cellstream.com/2018/10/24/ecmp-linux-paristr/
Can I gather statistics to measure network performance with Traceroute?
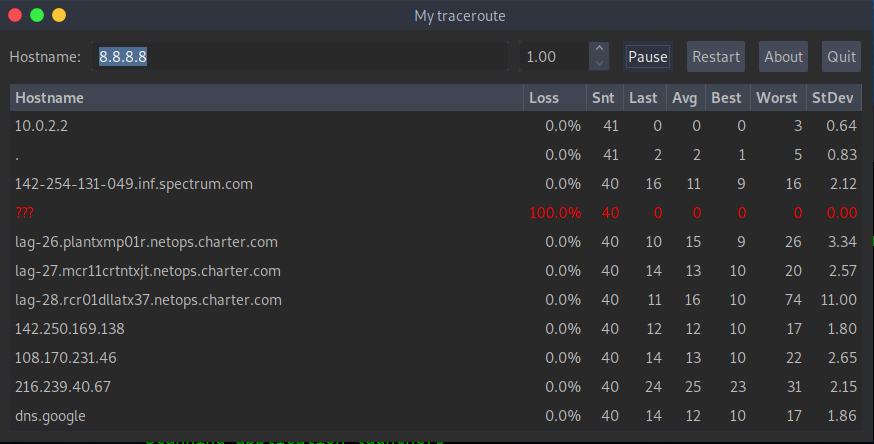
The answer is yes, but you are better off using Linux. In Linux there is a great tool called My Traceroute. You can read more on this tool here: https://www.cellstream.com/2018/05/14/my-traceroute-in-linux/ and you can end up with some cool testing. Here is an example where MTR has run multiple cycles on the traceroute process monitoring the performance, in this case 37 times!

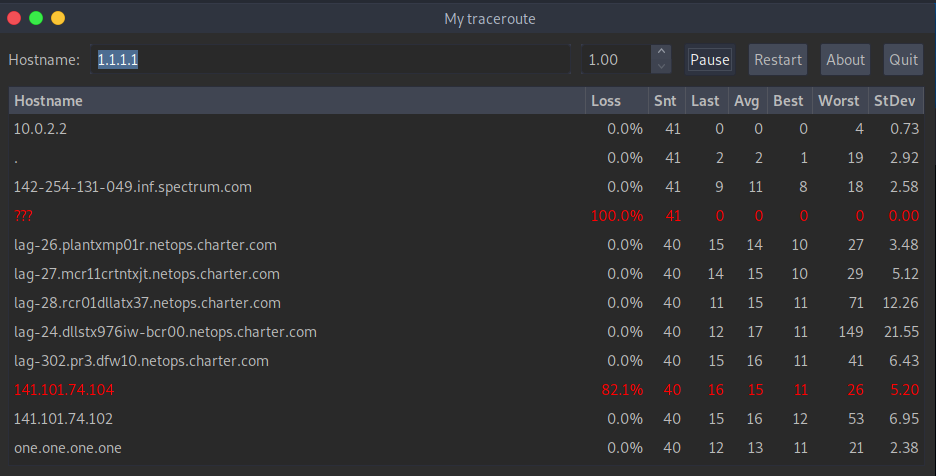
A more practical use case would be to discern which DNS is faster for you? Is 8.8.8.8 (Google) or 1.1.1.1 (Cloudfare) better for me?
Here is Google (11 hops – sum up the Avg column = 119 ms):

Here is Cloudfare (12 hops – sum up the Avg column = 134 ms):

Conclusion: for me, using the Google DNS is going to be faster.
I hope this has helped you learn yet another great networking tool called traceroute!


The one thing I should have added was what happens when your traffic enters into an MPLS tunnel? In most public networks, even though your packets are in a Label Switched Path – or an MPLS Tunnel – passing from router to router along that path, those routers are a) not doing Layer 3 processing of the MPLS encapsulated packets, and b) they probably do not carry the TTL field from the original IP packet that enters the tunnel to the TTL of the MPLS label. So therefore, they will not trigger the ICMP error message and therefore we don’t actually get to see those hops.
I have played with this a lot over the years, and while it is not definitive, I have always suspected that the asterisk hops are likely indicators you have entered into an MPLS LSP. Again not 100% by any means. In fact, many times you silently enter into the LSP with no idea it even exists.