Post Views: 442
|
Check out these great references as well: |
| Our custom profiles repository for Wireshark |
| Our Udemy course on Wireshark |
| Our Udemy course on Wireless Packet capture |
| tshark Objective | tshark Command |
| Available Interfaces | tshark -D |
| Help | tshark -h |
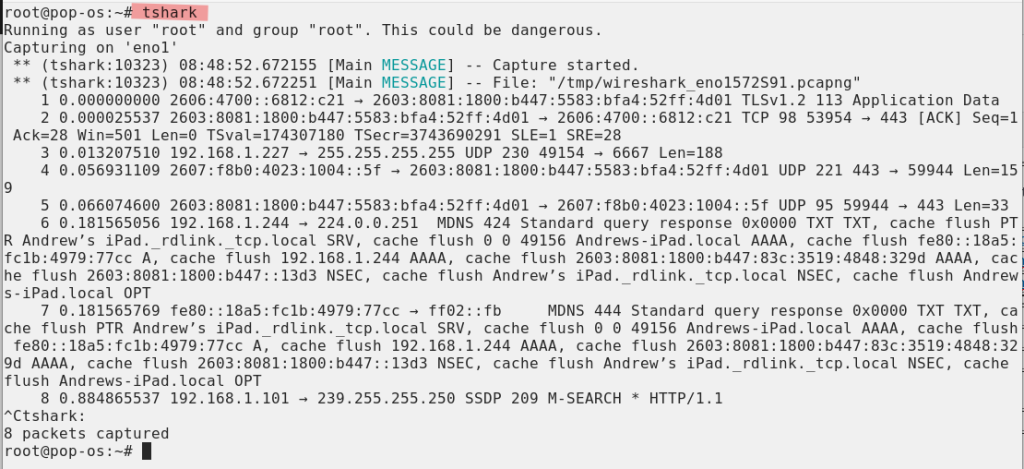
| Capture on an Interface | tshark -i # (where # is the interface number from -D command above) tshark -i ‘name’ (where ‘name’ is the interface name from -D command above) |
| Write capture to a file | tshark -i # -w {path and file name} |
| Capture using a filter | tshark -i # -f “filter text using BPF syntax” example: tshark -i 5 -f “tcp port 80” |
| Generic Capture for an IP Address | tshark -R “ip.addr == 192.168.0.1″ -r /tmp/capture.pcapng |
| Ethernet address 00:08:15:00:08:15 | eth.addr == 00:08:15:00:08:15 |
| Ethernet type 0×0806 (ARP) | eth.type == 0×0806 |
| Ethernet broadcast | eth.addr == ff:ff:ff:ff:ff:ff |
| No ARP | not arp |
| IPv4 only | ip |
| IPv6 only | ip6 |
| IPv4 address isn’t 192.168.0.1, don’t use != for this! | !(ip.addr == 192.168.0.1) |
| IPX only | ipx |
| TCP only | tcp |
| UDP only | udp |
| To include display filters in the command when examining a capture file | -Y <display filter> |
| UDP port isn’t 53 (not DNS), don’t use != for this! | !(tcp.port == 53) |
| TCP or UDP port is 80 (HTTP) | tcp.port == 80 || udp.port == 80 |
| HTTP Only | http |
| No ARP and no DNS | not arp and not (udp.port == 53) |
| Non-HTTP and non-SMTP to/from 192.168.0.1 | not (tcp.port == 80) and not (tcp.port == 25) and ip.addr == 192.168.0.1 |
| Creating a “;” separated file with “source IP” “destination IP” and “Destination Port” from all with SYN initiated connections, you can use following sample: Use the options -T , -E and -e (see man pages for infos) | tshark -nn -r capturefile.dmp -T fields -E separator=’;’ -e ip.src -e tcp.srcport -e ip.dst -e tcp.dstport ‘(tcp.flags.syn == 1 and tcp.flags.ack == 0)’ |
| Display http response codes | tshark -o “tcp.desegment_tcp_streams:TRUE” -i eth0 -R “http.response” -T fields -e http.response.code |
| Display Top 10 URLs | tshark -r capture.pcapng -R http.request -T fields -e http.host -e http.request.uri | sed -e ‘s/?.*$//’ | sed -e ‘s#^(.*)t(.*)$#http://12#’ | sort | uniq -c | sort -rn | head |
| Display Source IP and MAC Address. (coma sep) | tshark -i eth0 -nn -e ip.src -e eth.src -Tfields -E separator=, -R ip |
| Display Target IP and Mac Address (coma sep) | tshark -i eth0 -nn -e ip.dst -e eth.dst -Tfields -E separator=, -R ip |
| Source and Target IPv4 | tshark -i eth0 -nn -e ip.src -e ip.dst -Tfields -E separator=, -R ip |
| Source and Target IPv6 | tshark -i eth0 -nn -e ip6.src -e ip6.dst -Tfields -E separator=, -R ip6 |
| Source IP and DNS Query | tshark -i eth0 -nn -e ip.src -e dns.qry.name -E separator=”;” -T fields port 53 |
| Display only the Source and the Destination IP | tshark -o column.format:’”Source”, “%s”,”Destination”, “%d”‘ -Ttext |
| Various Statistics from a capture: We suggest you play with some of these command to check out the various statistics the individual commands offer. We use an example filename: capture.pcapng – just substitute this for the file name you want to analyze. | tshark -r capture.pcapng -qz io,stat,1,0,sum(tcp.analysis.retransmission)”ip.addr==10.10.10.10″ > stat.txt |
| tshark -r capture.pcapng -qz io,stat,120,”ip.addr==194.134.109.48 && tcp”,”COUNT(tcp.analysis.retransmission)ip.addr==194.134.109.48 && tcp.analysis.retransmission” | |
| tshark -r capture.pcapng -qz io,stat,30,”COUNT(tcp.analysis.retransmission) tcp.analysis.retransmission” | |
| tshark -r capture.pcapng -qz io,stat,30, “COUNT(tcp.analysis.retranmission)tcp.analysis.retransmission”, “AVG(tcp.window_size)tcp.window_sizeтАЭ,тАЭMAX(tcp.window_size)”, “MIN(tcp.window_size)tcp.window_size” | |
| tshark -r capture.pcapng -qz io,stat,5,”COUNT(tcp.analysis.retransmission) tcp.analysis.retransmission”,”COUNT(tcp.analysis.duplicate_ack)tcp.analysis.duplicate_ack”, “COUNT(tcp.analysis.lost_segment) tcp.analysis.lost_segment”, “COUNT(tcp.analysis.fast_retransmission) tcp.analysis.fast_retransmission” | |
| tshark -r capture.pcapng -qz io,stat,5,”MIN(tcp.analysis.ack_rtt)tcp.analysis.ack_rtt”, “MAX(tcp.analysis.ack_rtt)tcp.analysis.ack_rtt”,”AVG(tcp.analysis.ack_rtt)tcp.analysis.ack_rtt” | |
| tshark -r capture.pcapng -qz ip_hosts,tree | |
| tshark -r capture.pcapng -qz ptype,tree | |
| Display all IP conversations in a capture file | tshark -r capture.pcapng -qz conv,ip |
| Display all TCP conversations in a capture file | tshark -r capture.pcapng -qz conv,tcp |
| Display the number of HTTP redirections in a capture file | tshark -r capture.pcapng -Y “http.response.code in {300..399}” | wc -l |
| Display the users where an iphone has connected to the network | tshark -r capture.pcapng \ -Y ‘lower(dhcp.option.hostname) contains “iphone” ‘ \ -T fields -e dhcp.option.hostname | \ sort -u |
| Display the average DNS response time | tshark -r capture.pcapng \ -Y dns.time \ -T fields -e dns.time | \ awk ‘{sum+=$1;count+=1} END {printf(“%9.6f\n”,sum/count)}’ |
| Display the slowest DNS response time | tshark -r nfl.pcapng \ -Y “dns.flags.response == 1 and dns.time” \ -T fields -e dns.time | \ sort -rn | \ head -1 | \ sed ‘s/0*$/ seconds/’ |
| Display hosts that do not support SACK | tshark -r capture.pcapng \ -Y “tcp.flags.syn==1 and (tcp.flags.ack==0 or (tcp.flags.ack == 1 and tcp.stream in {$( \ tshark -r capture.pcapng -Y “tcp.flags.syn==1 and tcp.flags.ack==0 and tcp.options.sack_perm” \ -T fields -e tcp.stream | sort -u | xargs \ ) 4294967295} ) ) and not tcp.options.sack_perm” \ -T fields \ -e ip.src |

