
|
Check out these great references as well: |
| Our custom profiles repository for Wireshark |
| Our Udemy course on Wireshark |
| Our Udemy course on Wireless Packet capture |
Wireshark is a great graphical tool for performing packet analysis and we all agree that the GUI is wonderful, especially the new 2.x interface and later.
But, what if you do not like GUI, or do not have a GUI and still want to capture packets? The simple answer is tshark! tshark is essentially a terminal window version of Wireshark. This article will show you How to use tshark – a starting point.
I should note here that neither Wireshark nor tshark actually do the packet capture. They both use the program dumpcap.exe in the background to capture packets.
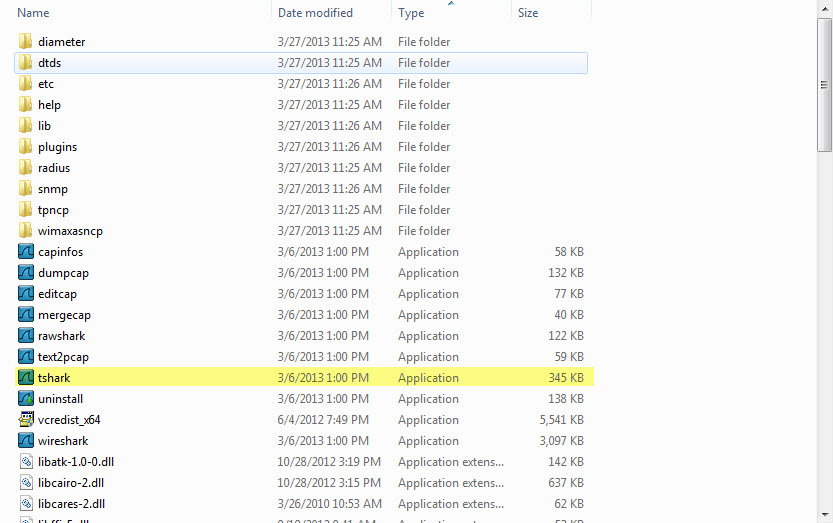
Both dumpcap and tshark come with your Wireshark distribution. If you look at the directory where Wireshark installed, you will find you also received a number of other tools:
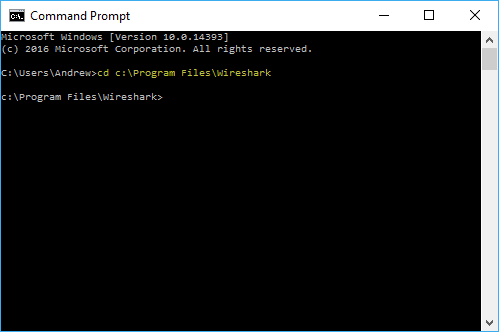
To access tshark, simply open a Terminal or command line window (in Windows Start> Run> cmd) and when the terminal opens, you will need to change directory to the Wireshark directory:
Now that you are there, you will need to get the Interface numbers so you can specify which interface you want to capture on. Enter “tshark -D” on the command line:
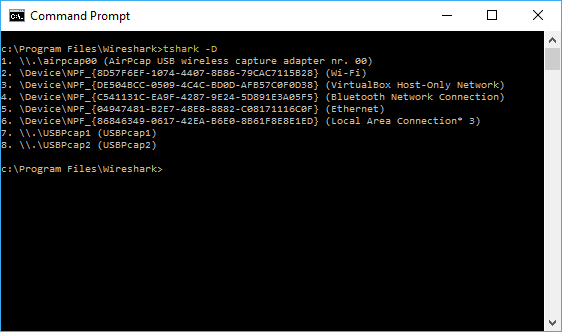
You can see that the system responds with the available interfaces and numbers along side each one. These numbers are extremely important to other tshark commands.
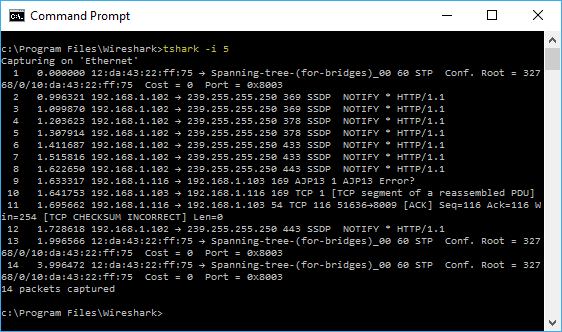
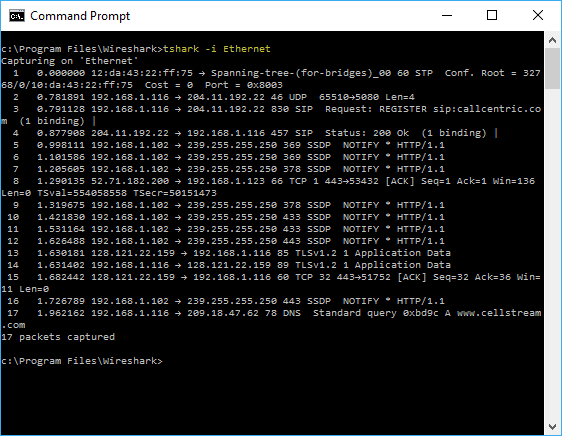
Let’s capture on interface #5 on my machine which is my Ethernet interface.
The command to do this is: “tshark -i #” replacing the # with the interface number (hit CTRL-C to stop the capture):
Another option would be to use what my operating system associates as a name for the interface. On my system it is the “Ethernet” interface, on Linux and MAC it may be “eth0” or “eth1”:
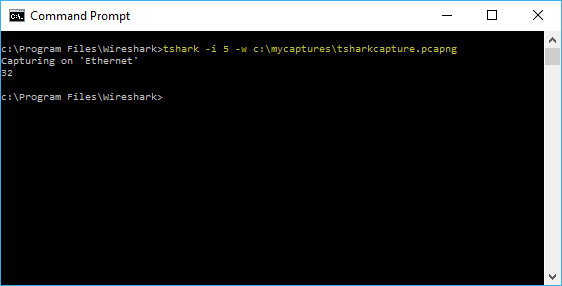
The problem here is that while the captured traffic was sent to your terminal window, they are not stored anywhere. Most users will want to capture to a file, where they can access the file and open it in the GUI version of Wireshark or some other packet dissection tool.
The basic command for doing this is: “tshark -i # -w filename” again replacing the # with an interface number and the word filename with the path and file name.
Now we will see the file in the location we specified:
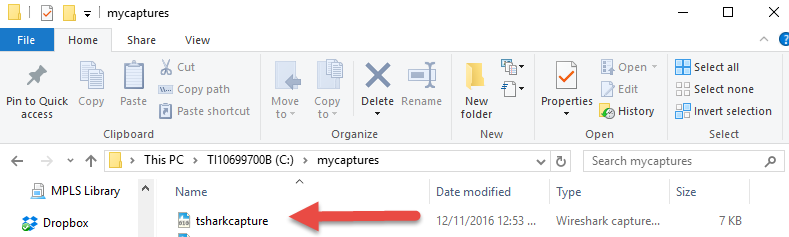
Nice, we could now open this file with the Wireshark GUI or some other tool.
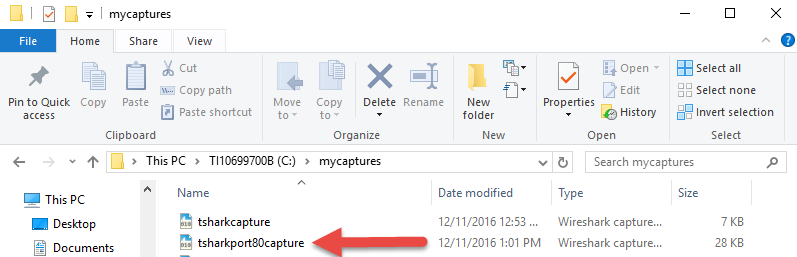
Lastly for this article, you can apply filters, so let’s say I want to only capture port 80 (HTTP) traffic, I would use the -f command and then specify the filter string (remember we use Berkley Packet Filter syntax – and you have to know the syntax!!). In this example we would use ‘tshark -i # -f “tcp port 80” -w c:\mycaptures\tsharkport80capture.pcapng’:
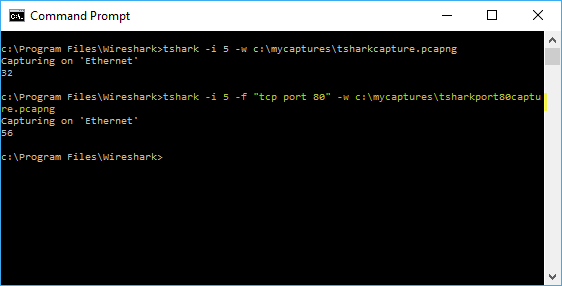
And that file will now appear in the path I specified:
There are a ton of other things you can do as well. Here is the tshark -h help output:
c:\Program Files\Wireshark>tshark -h
TShark (Wireshark) 2.2.2 (v2.2.2-0-g775fb08)
Dump and analyze network traffic.
See https://www.wireshark.org for more information.
Usage: tshark [options] …
Capture interface:
-i <interface> name or idx of interface (def: first non-loopback)
-f <capture filter> packet filter in libpcap filter syntax
-s <snaplen> packet snapshot length (def: 65535)
-p don’t capture in promiscuous mode
-I capture in monitor mode, if available
-B <buffer size> size of kernel buffer (def: 2MB)
-y <link type> link layer type (def: first appropriate)
-D print list of interfaces and exit
-L print list of link-layer types of iface and exit
Capture stop conditions:
-c <packet count> stop after n packets (def: infinite)
-a <autostop cond.> … duration:NUM – stop after NUM seconds
filesize:NUM – stop this file after NUM KB
files:NUM – stop after NUM files
Capture output:
-b <ringbuffer opt.> … duration:NUM – switch to next file after NUM secs
filesize:NUM – switch to next file after NUM KB
files:NUM – ringbuffer: replace after NUM files
RPCAP options:
-A <user>:<password> use RPCAP password authentication
Input file:
-r <infile> set the filename to read from (- to read from stdin)
Processing:
-2 perform a two-pass analysis
-R <read filter> packet Read filter in Wireshark display filter syntax
-Y <display filter> packet displaY filter in Wireshark display filter
syntax
-n disable all name resolutions (def: all enabled)
-N <name resolve flags> enable specific name resolution(s): “mnNtCd”
-d <layer_type>==<selector>,<decode_as_protocol> …
“Decode As”, see the man page for details
Example: tcp.port==8888,http
-H <hosts file> read a list of entries from a hosts file, which will
then be written to a capture file. (Implies -W n)
–disable-protocol <proto_name>
disable dissection of proto_name
–enable-heuristic <short_name>
enable dissection of heuristic protocol
–disable-heuristic <short_name>
disable dissection of heuristic protocol
Output:
-w <outfile|-> write packets to a pcap-format file named “outfile”
(or to the standard output for “-“)
-C <config profile> start with specified configuration profile
-F <output file type> set the output file type, default is pcapng
an empty “-F” option will list the file types
-V add output of packet tree (Packet Details)
-O <protocols> Only show packet details of these protocols, comma
separated
-P print packet summary even when writing to a file
-S <separator> the line separator to print between packets
-x add output of hex and ASCII dump (Packet Bytes)
-T pdml|ps|psml|json|ek|text|fields
format of text output (def: text)
-j <protocolfilter> protocols layers filter if -T ek|pdml|json selected,
(e.g. “http tcp ip”,
-e <field> field to print if -Tfields selected (e.g. tcp.port,
_ws.col.Info)
this option can be repeated to print multiple fields
-E<fieldsoption>=<value> set options for output when -Tfields selected:
bom=y|n print a UTF-8 BOM
header=y|n switch headers on and off
separator=/t|/s|<char> select tab, space, printable character as separator
occurrence=f|l|a print first, last or all occurrences of each field
aggregator=,|/s|<char> select comma, space, printable character as
aggregator
quote=d|s|n select double, single, no quotes for values
-t a|ad|d|dd|e|r|u|ud output format of time stamps (def: r: rel. to first)
-u s|hms output format of seconds (def: s: seconds)
-l flush standard output after each packet
-q be more quiet on stdout (e.g. when using statistics)
-Q only log true errors to stderr (quieter than -q)
-g enable group read access on the output file(s)
-W n Save extra information in the file, if supported.
n = write network address resolution information
-X <key>:<value> eXtension options, see the man page for details
-U tap_name PDUs export mode, see the man page for details
-z <statistics> various statistics, see the man page for details
–capture-comment <comment>
add a capture comment to the newly created
output file (only for pcapng)
Miscellaneous:
-h display this help and exit
-v display version info and exit
-o <name>:<value> … override preference setting
-K <keytab> keytab file to use for kerberos decryption
-G [report] dump one of several available reports and exit
default report=”fields”
use “-G ?” for more help
You can find more articles on tshark by clicking here.
Enjoy!
Comments are welcomed below from registered users. You can also leave comments at our Discord server.
If you would like to see more content and articles like this, please support us by clicking the patron link where you will receive free bonus access to courses and more, or simply buying us a cup of coffee!