

Here is the download link: https://github.com/HelgeMagnusKeck/WinFi – look to the right, you will see Releases, and the latest release can be downloaded.
Here is the Discord Server to join in discussions and request PRO Engineer version activation: https://discord.gg/4GTv5ED7
This tool is free – and there is a PRO Engineer version that costs money.
After test driving this new tool, I can say it is perhaps the best free Windows Wi-Fi analyzer out there. The installation was swift and painless.
Here is what the initial start screen looks like:
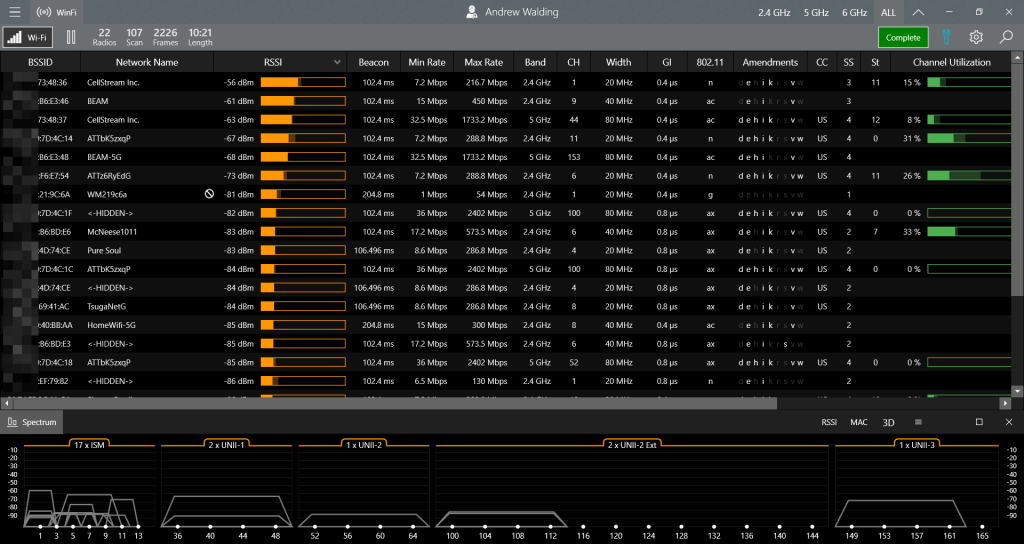
The free version is shown.
The first thing that hits you is it is similar to other Wi-Fi analyzers with the exception that is shows both the 2.4 Ghz , 5 Ghz and 6GHz channels at the top of the screen! Nice.
The usual column display is on the top displaying BSSID, Network Name, Vendor Name (this is actually better than some other tools in recognizing vendors from he MAC address OUI), RSSI, Beacons, Rates, Band, Channel, Width and then a series of 802.11 specific details. It is here that this program leaps ahead of all the others. I love the MAC age column that reveals older systems that may have more known vulnerabilities.
You can click on any of the columns to sort the information on that particular column. On mine, I am sorting on the RSSI column.
Clicking on any of the column headers allows you to sort (the default is to sort on RSSI).
A word of warning – in the release I am reviewing, when you hover on items you don’t get any help or indicator as to what that item is (version 0.9.86.0)
The top tool bar looks as follows:

You will see Scanning<->Complete as the programs scans. Good idea to let this run a while and gather as much information as possible. Also note the three lines menu (the hamburger) in the top left. By default ALL spectrum ranges are shown. Clicking on the 2.4GHz or 5GHz or 6GHz will only show those frequency ranges.
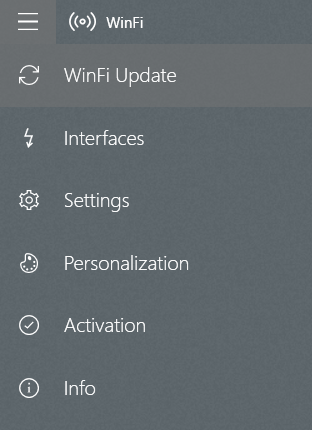
Clicking on the hamburger reveals the following options:
You will also see a gear icon and a tool icon. Clicking the tool icon will toggle the channel views at the bottom of the display:

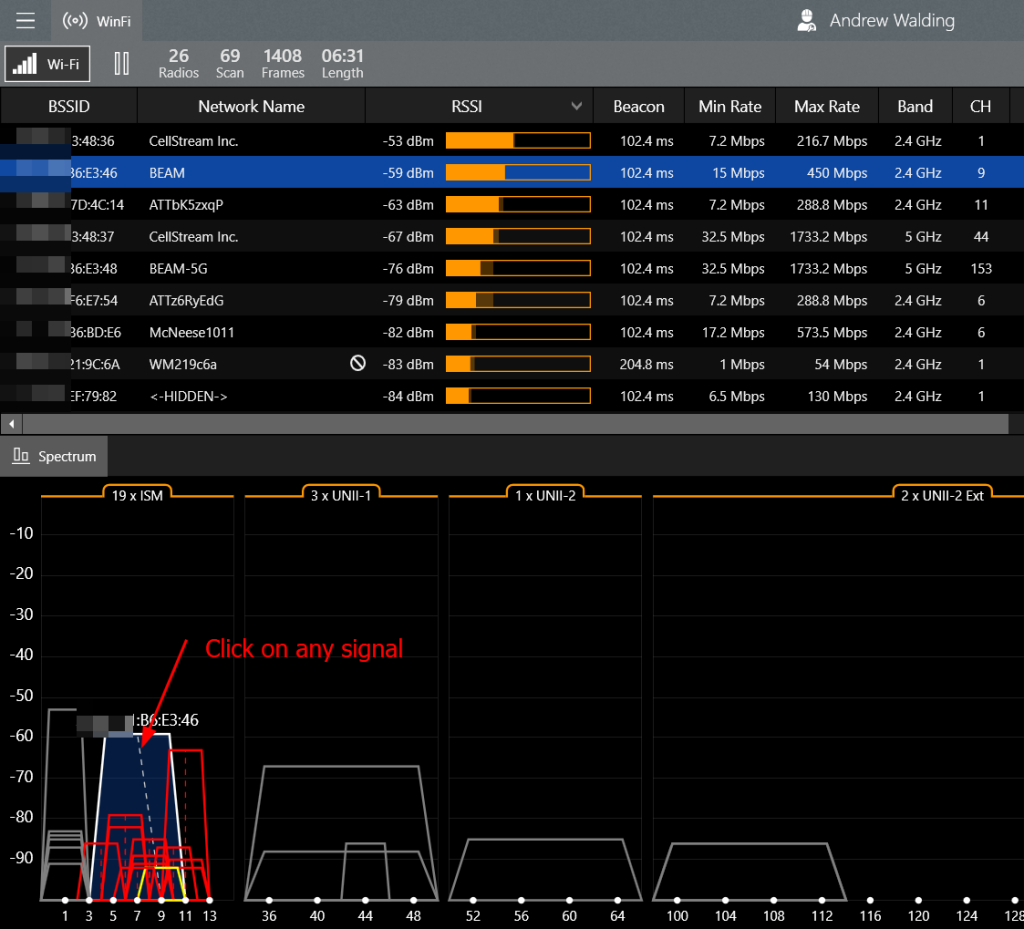
Click on any of the radio signal in the graph or in the list. The one selected will be white, and then all the other signals that are being interfered with will be red. Also, the particular system will be highlighted in blue in the BSSID list:
Above this part of the display are options to affect that part f the screen:

The small hamburger menu here allows you to add captions to this part of the screen. It’s easy to toggle these things on and off for settings you may prefer.
On the top left is a “Pause”/”Play” button so you can pause and restart scanning. Next is the drop down which lets you select the interface to use for scanning, so the program supports multiple interfaces.
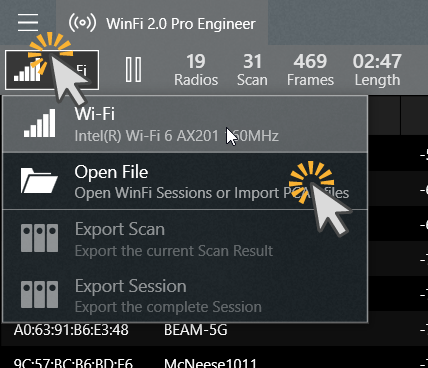
If you click on the Wi-Fi button, you will see the following:
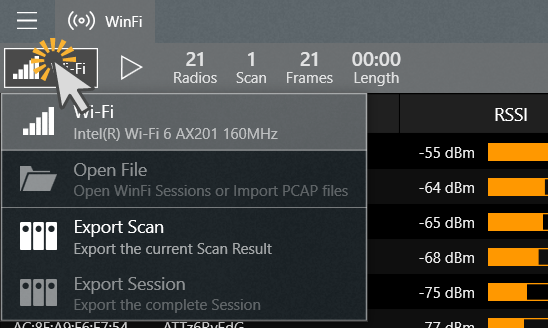
You see information about the Wi-Fi interface, and then options to open a prior WinFi saved session as well as export scan results and sessions.
ach other because they show output for whatever network you have selected in the top part of the screen.
If you click on the gear icon, you will see some options: Data Grid, Columns, and Colors.

I have expanded the first of those above. You can adjust these settings as you prefer.
The Columns allows you to select which items are shown in the grid. There are lots of options here.
The Colors option allows you to customize some of the colors.
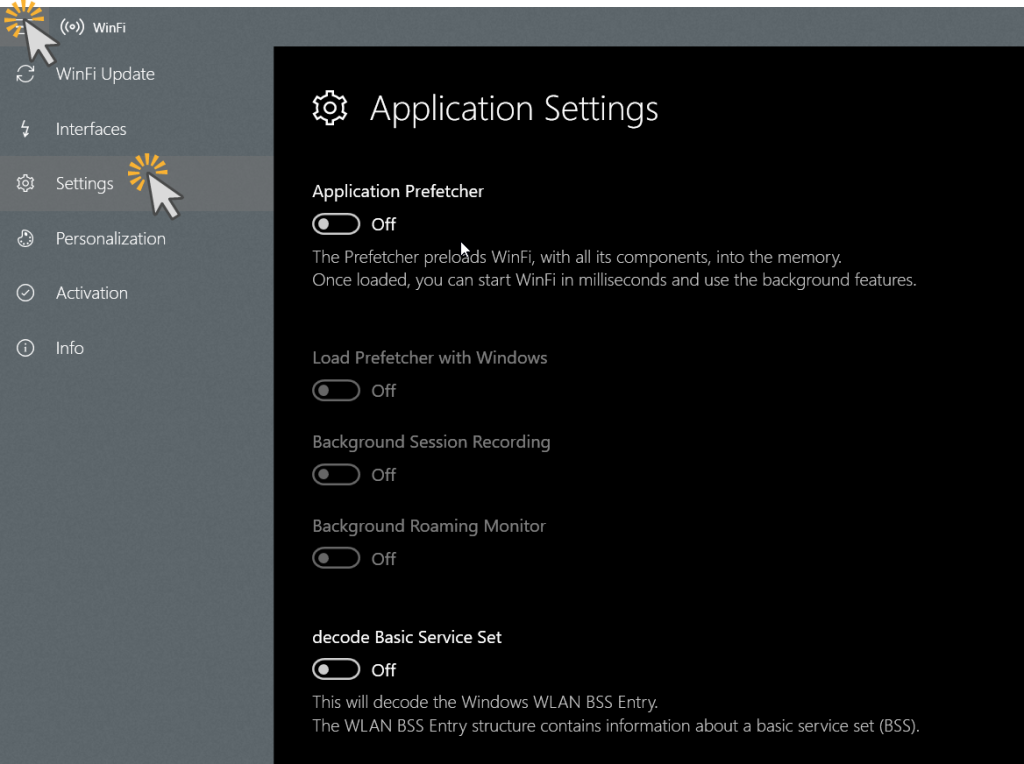
In the hamburger menu there are settings you can adjust:
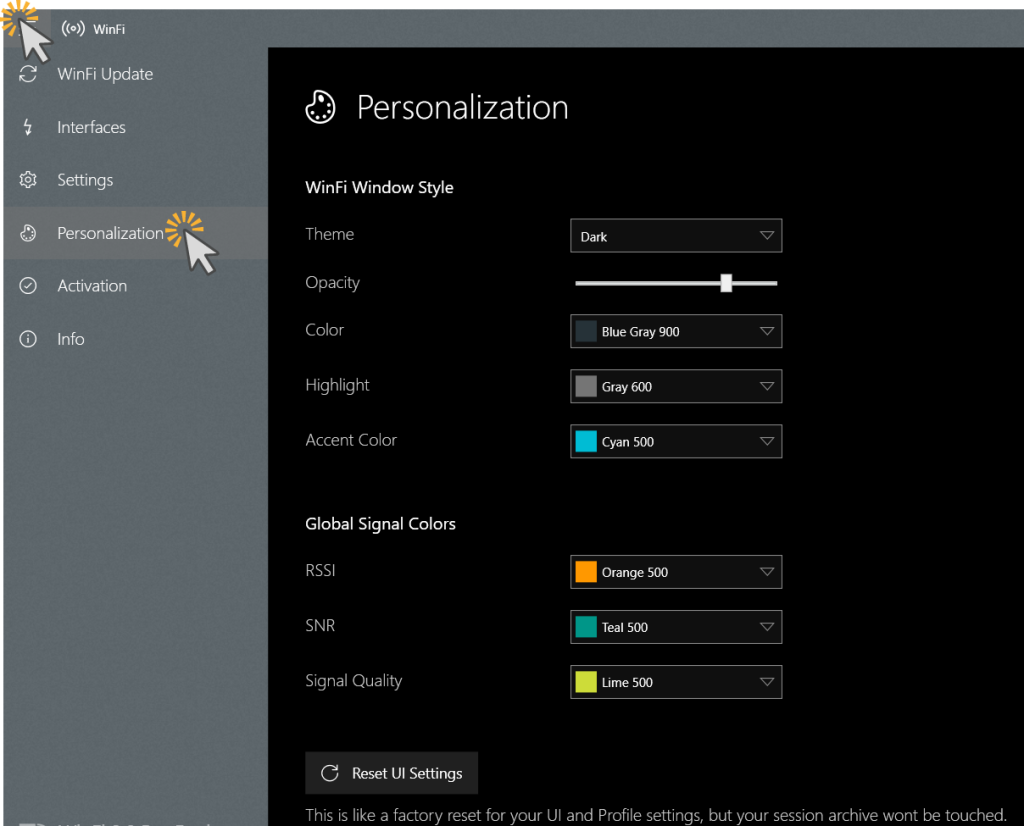
Further you can edit some personalizations from that same hamburger menu:
Why Do you need the PRO version?
There are a number of additional features you get if you acquire the PRO version. My favorite is the capability of having different “profiles” or views. With the PRO version the screen looks like this:

You can see in the top right, is the “Default view”. By clicking on this item, you get the following drop down:
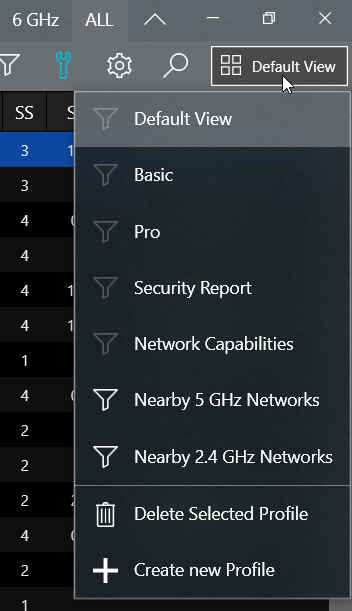
From this drop down menu you can select some predefined views, as well as then create your own profile, and then edit the screen to your liking and save that view. This is awesome stuff and you will not find anything like this in any other scanner that I know of. For me this feature is a game changer.
Another cool feature is the ability to open pcap files. They do not have to be based on monitor mode with the RadioTap headers. Just click on the Wi-Fi icon near the top left and then select open file:
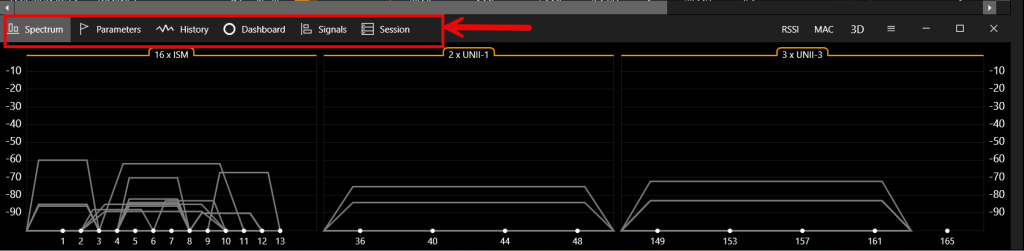
Then comes the cool stuff. With the Pro Engineer version, you will see a bunch of options above the Spectrum:
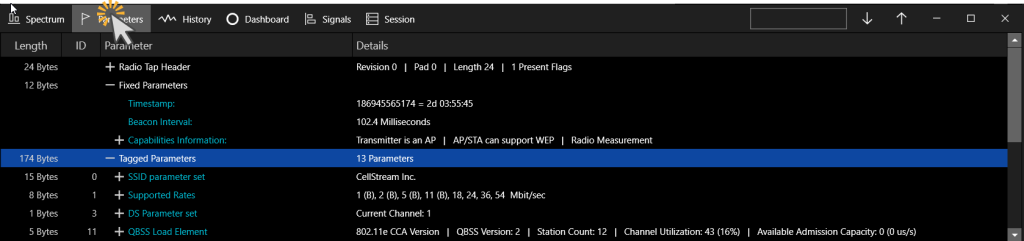
If you first select a BSIID on the list in the top part of the display, you can then see Parameters:
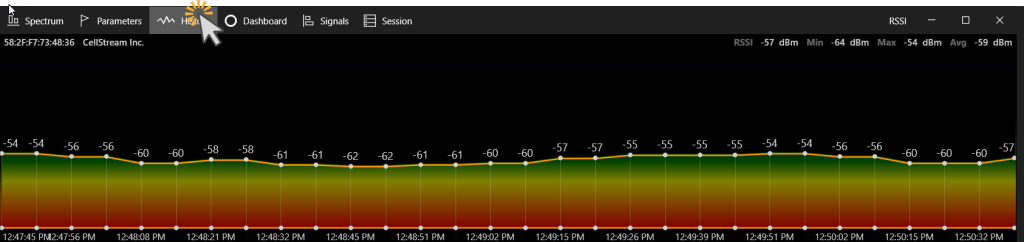
History:
Dashboard:

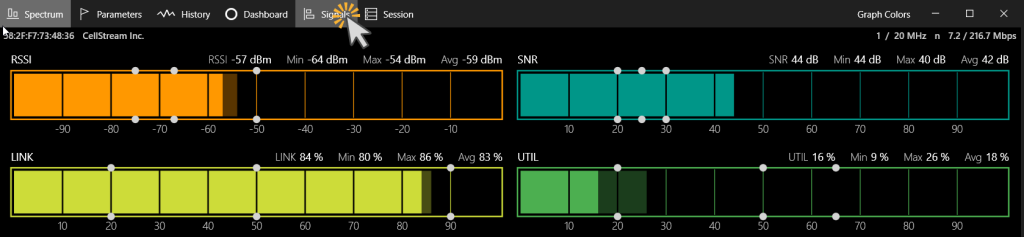
and Signals:
There is so much here that anyone’s preferences or needs are easily met with this analyzer.
That is my brief review. I love this tool and will continue recommending it in my Wi-Fi classes.
If you would like to help support the continued development of independent networking, broadband, Wi-Fi, VoIP, and packet analysis content, please consider joining our Patreon community where you will gain access to exclusive technical resources, downloadable labs and PCAPs, bonus course content, troubleshooting guides, and additional member-only material. Comments and technical discussion are always welcomed at our Patreon community or on our Discord server. You can also support our work by simply buying us a coffee — every contribution helps us continue creating practical, real-world network science education for professionals and enthusiasts alike.