
Microsoft has added a packet sniffing/packet capture tool in the latest Windows 10 update.
We have previously discussed using the ‘netsh’ command to do packet capture in Windows (see my article here).
The pktmon tool is new. What does this mean? Is it better than netsh? Does it integrate with Wireshark?
Well, it means you can, with Administrator permissions, perform packet capture on a Windows 10 machine with this new tool. But, along with the Administrative requirements, there are a few let downs. Let’s dig in.
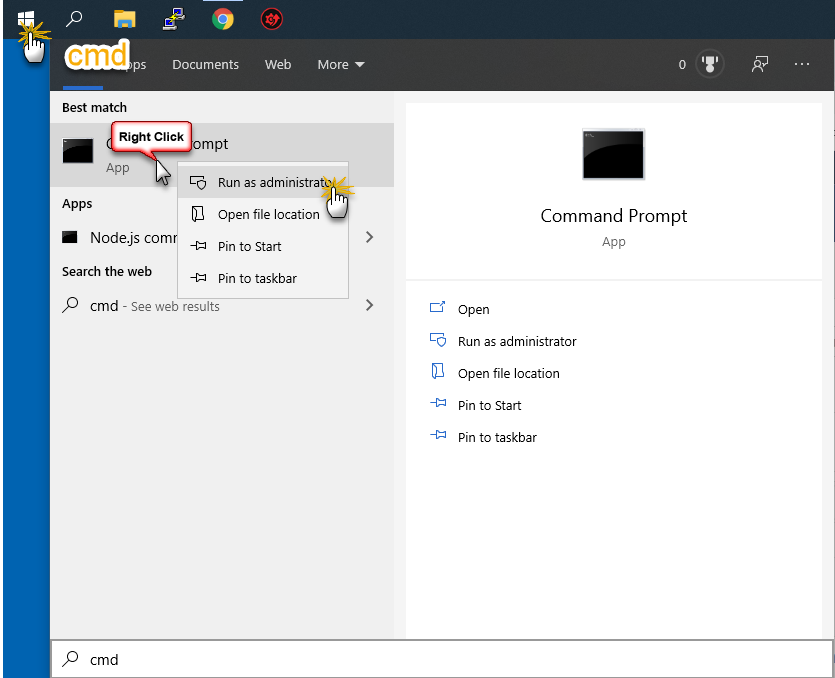
First, you need to either open Powershell or CMD, as administrator. So Windows Button> cmd> Run as Administrator:
You will know you have this right if the Command Line window looks like this:
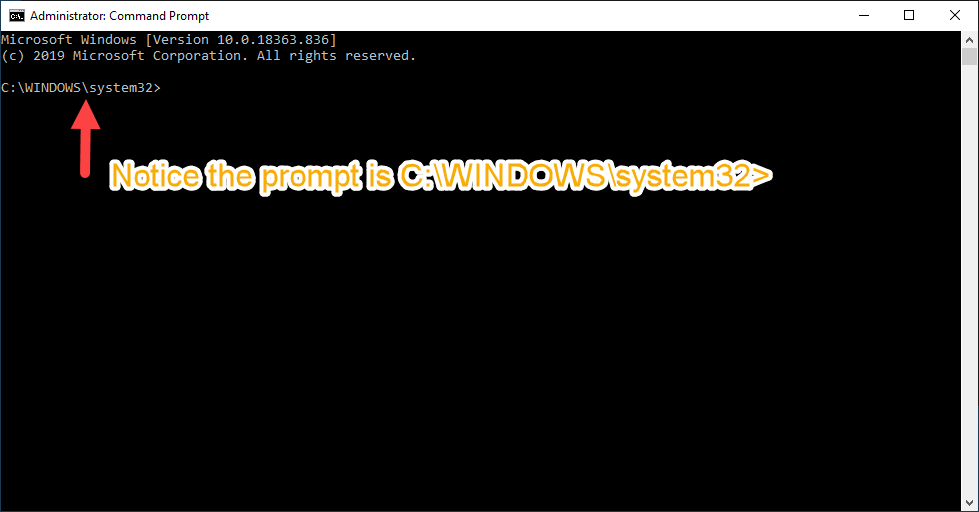
Perfect!
Now we can play a little. The pktmon.exe program, or Packet Monitor, is the network sniffer or network diagnostic and packet monitoring tool. It is located in the Systems folder, which is where we have landed.
Whenever you use a command line tool like this it is always good to look for any help. Now usually this is done with the -h or -help command line switch, but not in this case. Furthermore, as you will see, the output of the help depends on the command line rather than giving us everything at once, which is clunky at best. Regardliess, lets look at the help:
pktmon help
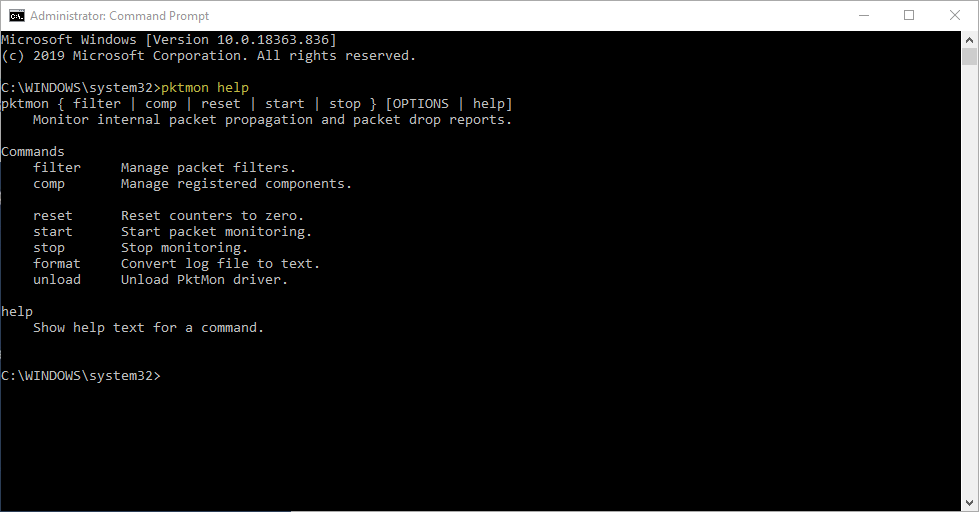
You can see the top level commands are:
- filter: Manage packet filters
- comp: Manage registered components
- reset: Reset counters to zero
- start: Start packet monitoring
- stop: Stop monitoring
- format: Convert log file to text
- unload: Unload PktMon driver
These are then followed by Options, that are not defined on this screen.
Naturally we want to filter. So to find out what the options are you have to type:
pktmon filter help
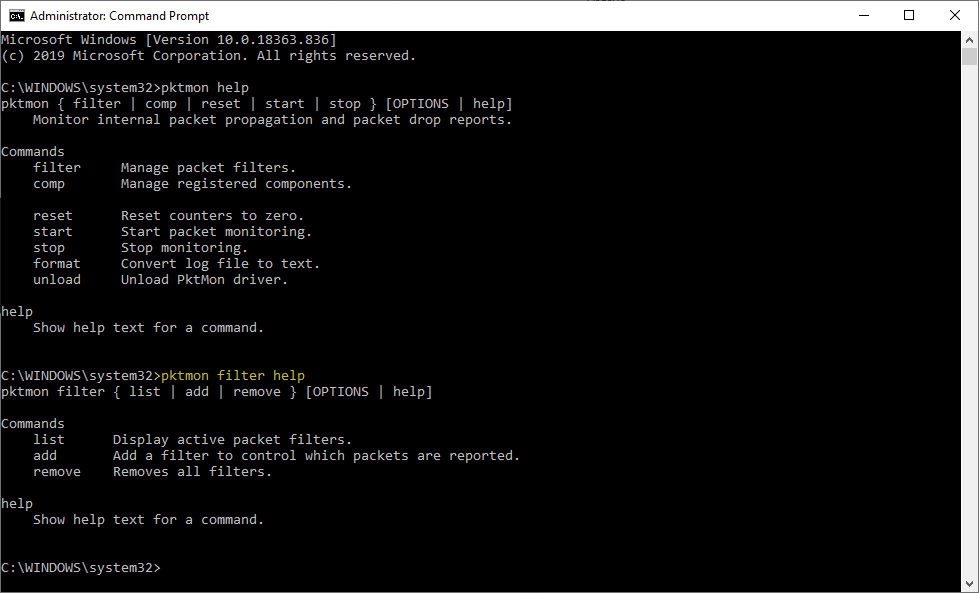
OK – we see how this is going to go. As I said: clunky.
Let’s go one step further:
pktmon filter add help
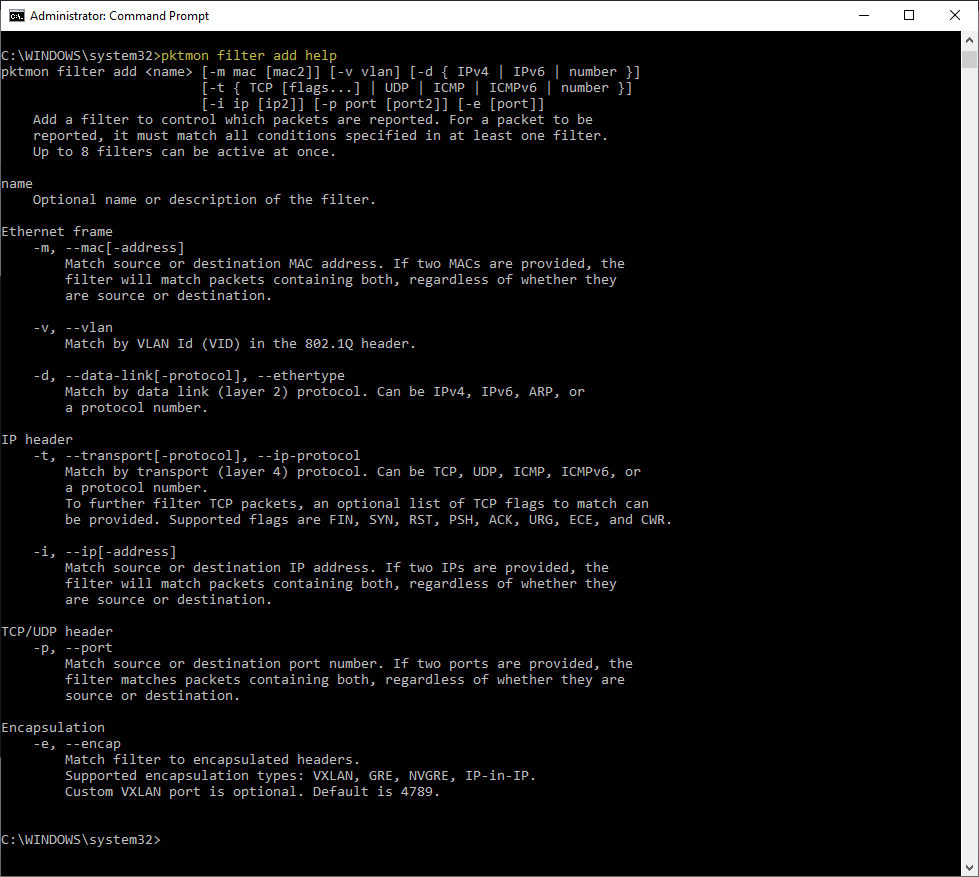
OK everyone gets the idea of how the help system works.
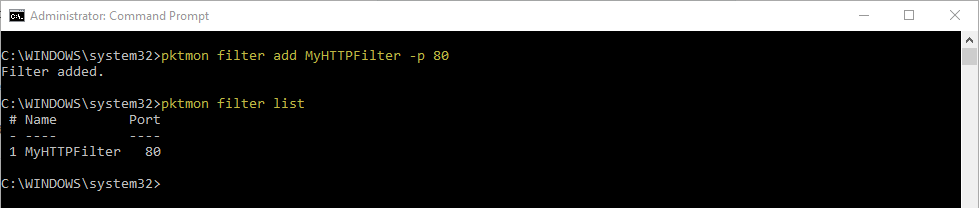
It is interesting that we can filter on some of the latest technologies like VXLAN and such. Let’s create a filter. Let’s say I want to capture all HTTP/HTTPS traffic. We see in the help there is the ability to select port number. So lets add a filter for port 80:
pktmon filter add MyHTTPFilter -p 80
Notice I named the filter “MyHTTPFilter”. This is optional. Then I followed up with a request to show the filter list:
pktmon filter list
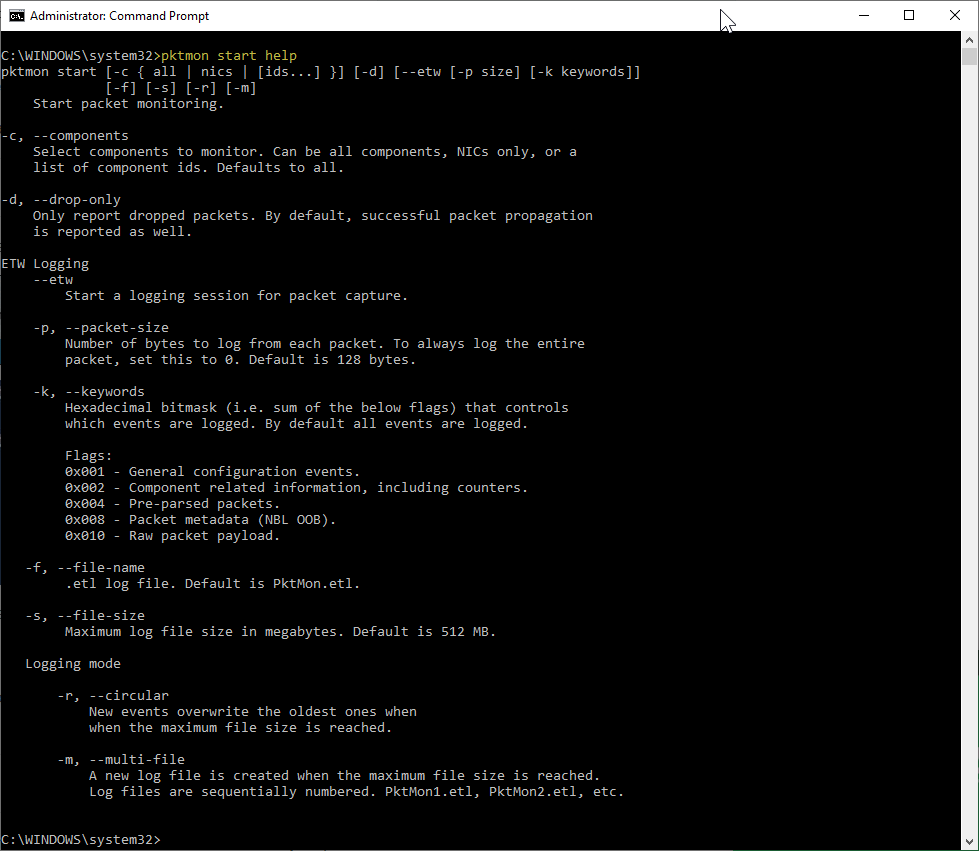
Now we want to start sniffing/capturing. Let’s get some help on the ‘start’ command:
pktmon start help
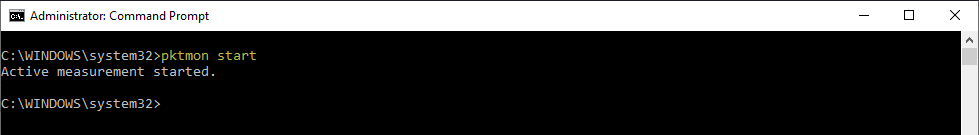
Let’s just do a simple start command first.
pktmon start
Hmm. OK, let’s stop the process (now I did open a browser and went to a site or two to generate traffic):
pktmon stop
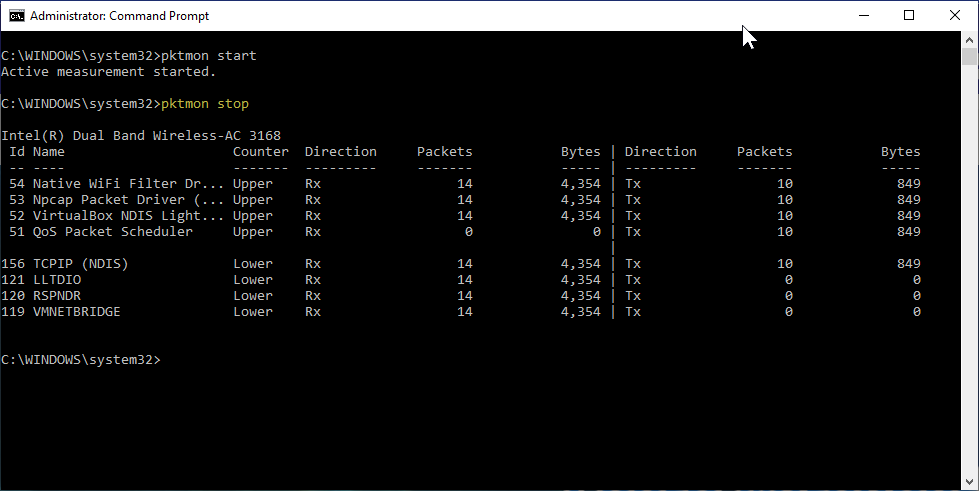
So just a report. No actual packets. Remember our port 80 filter is in play.
To start real-time logging of the data traffic (at all network adapters of the machine), we need to use the following command:
pktmon start –etw
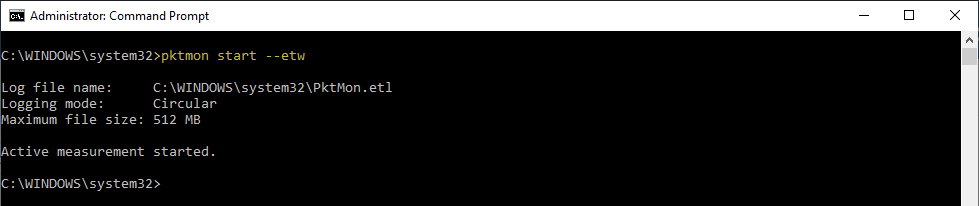
We can see that a file is created in the \system32 directory called PktMon.etl.
I once again openned a couple of web pages and then stopped the capture:
pktmon stop
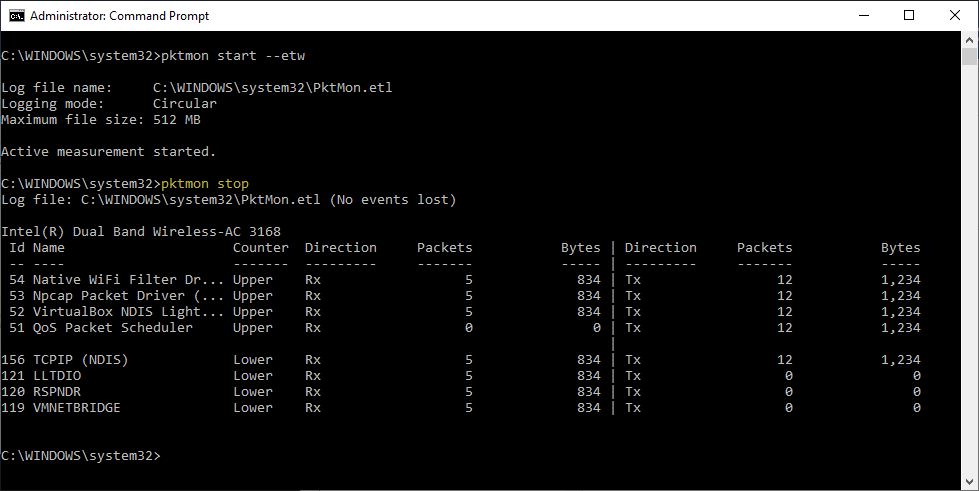
So what does this file look like? The .etl is a Microsoft event viewer log file and supposedly you can import into the Windows Event Viewer and then view the file. No thanks.
Now you could open this in Microsoft Network Monitor. Go to this link and download/install Microsoft Network Monitor v3.4. This is ancient software (actually in Microsoft’s archives) but works on all older and newer versions of windows (I am using Windows 10 and it is perfect).
No thanks.
Instead, the .etl file can be converted to a text file by using the following command:
pktmon format PktMon.etl -o c:\pktmoncapture.txt
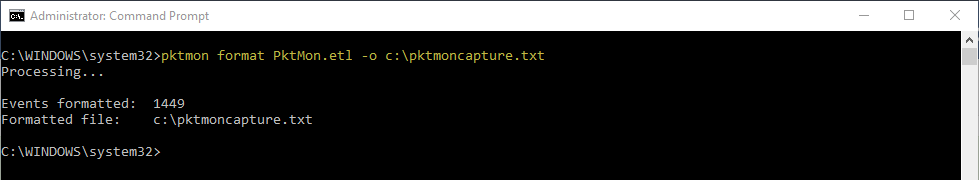
This text file can then be loaded and evaluated in a text editor like Notepad++:
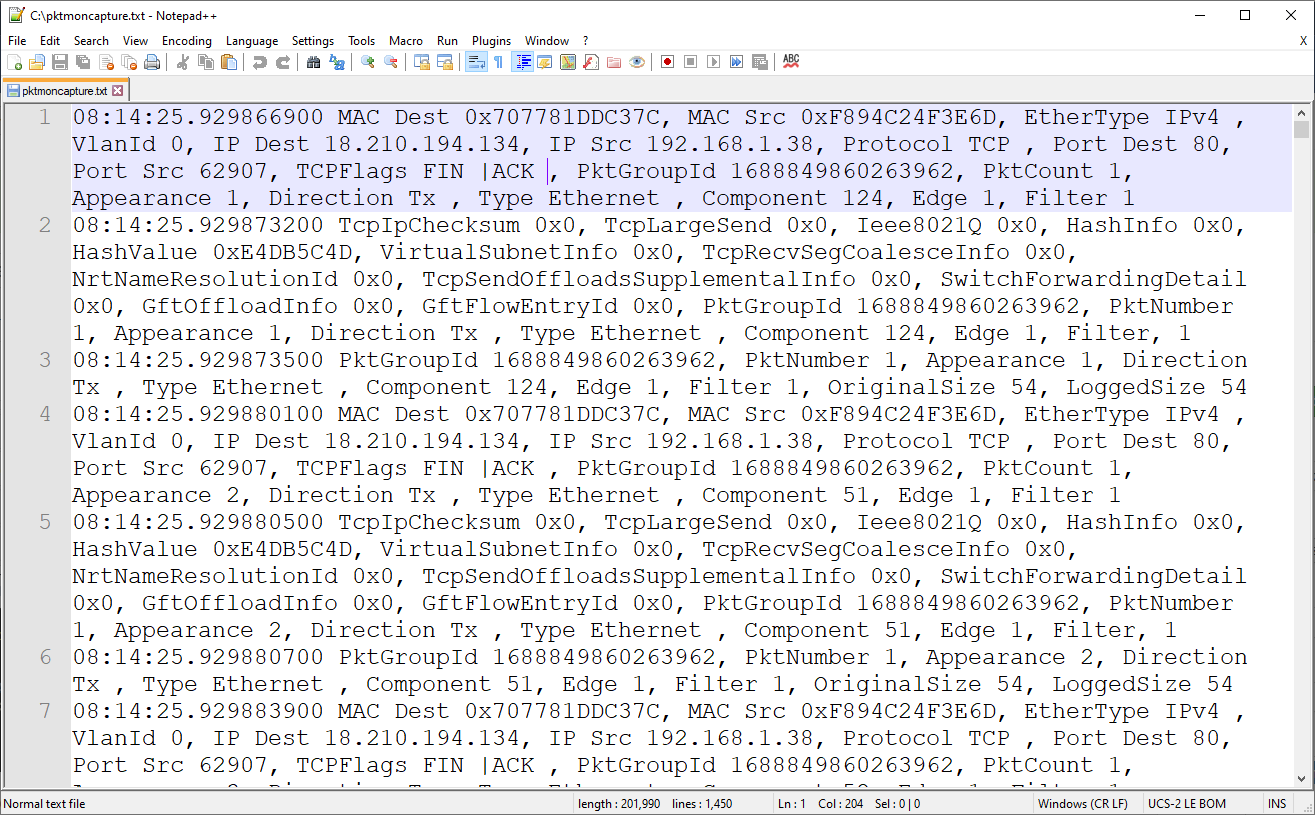
Looks like each packet is a single comma separated value line. This reminds me of tcpdump.
But it each one appears to be a limited length. By default, only the first 128 bytes of a packet are saved. To capture the entire packet, you have to add the -p 0 command line switch. Example:
pktmon start --etw -p 0
Too late, let’s continue.
Now the question is, can Wireshark input this?
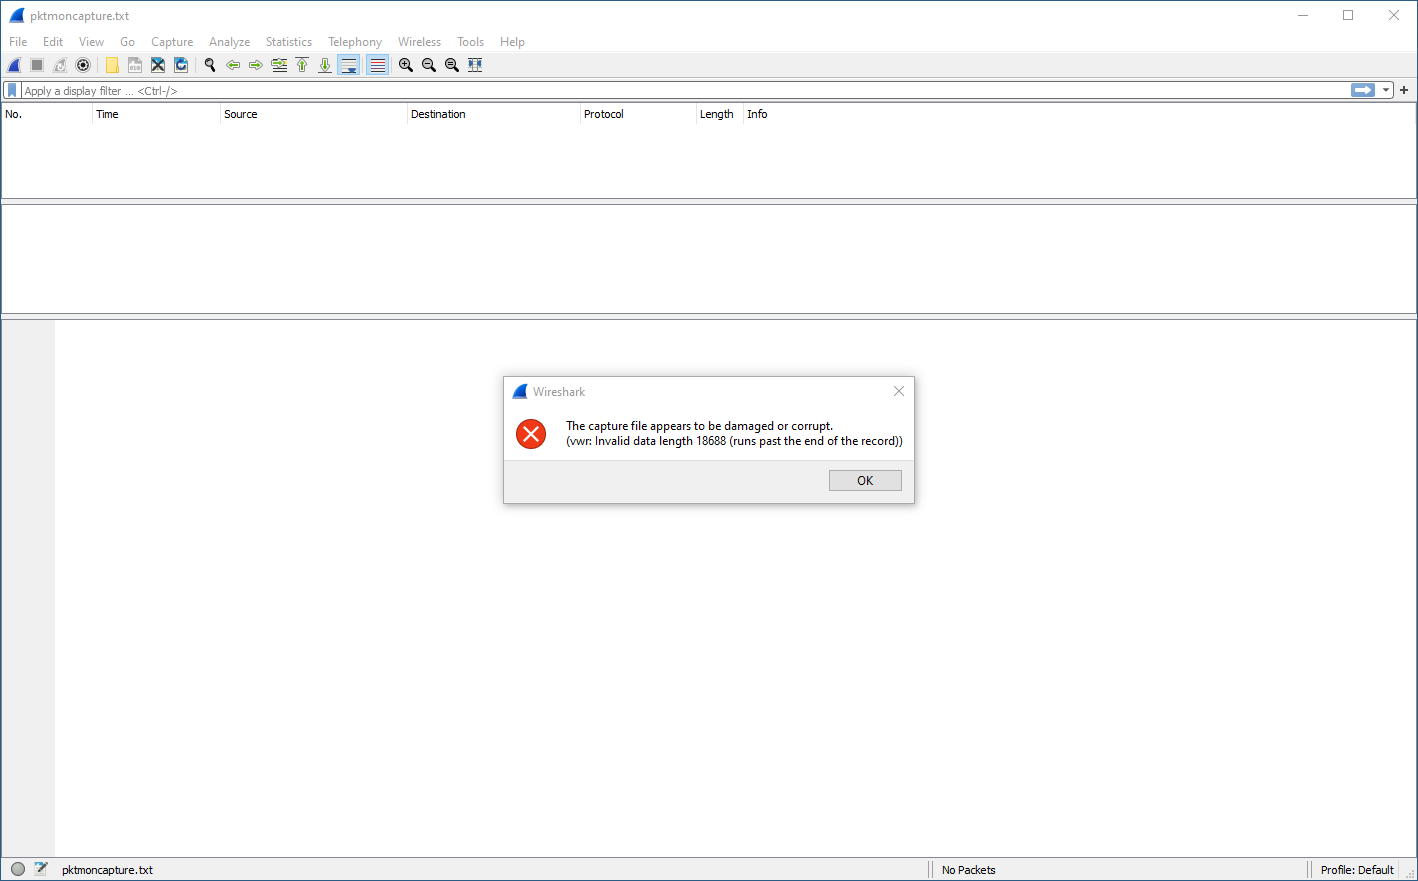
NO!
There is a tool called text2pcap.exe that comes with Wireshark. So below, I changed to the Wireshark directory after copying the text file there, and ran the tool:
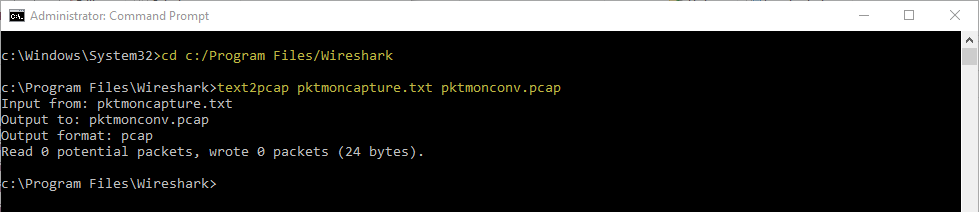
FAIL!
We have heard there are updates coming to pktmon, but unless you sign up for Microsoft Insider prereleases, you will not see these updates. They apparently include ability to output .pcapng formats, and updating screen information in real time. When this happens, I will update the article.
For now, I will just add a couple of things. When you want to start the capture, most of us will want to specify the interface we want to capture on. I would expect a little more clarity on the interface options, but this requires a little decoding.
We see that pktmon wants a component ID with the -c command switch. So where do we find these? The answer I thought was look at the adapters list in Windows. To list the interface adapters in Windows 10 you can always do an ‘ipconfig /all’, but what you really need to do is use netsh (you can read more on netsh here). But neither of these helped. So I went back to pktmon. You will see below, I checked help as I went, then I ran the following command:
pktmon comp list
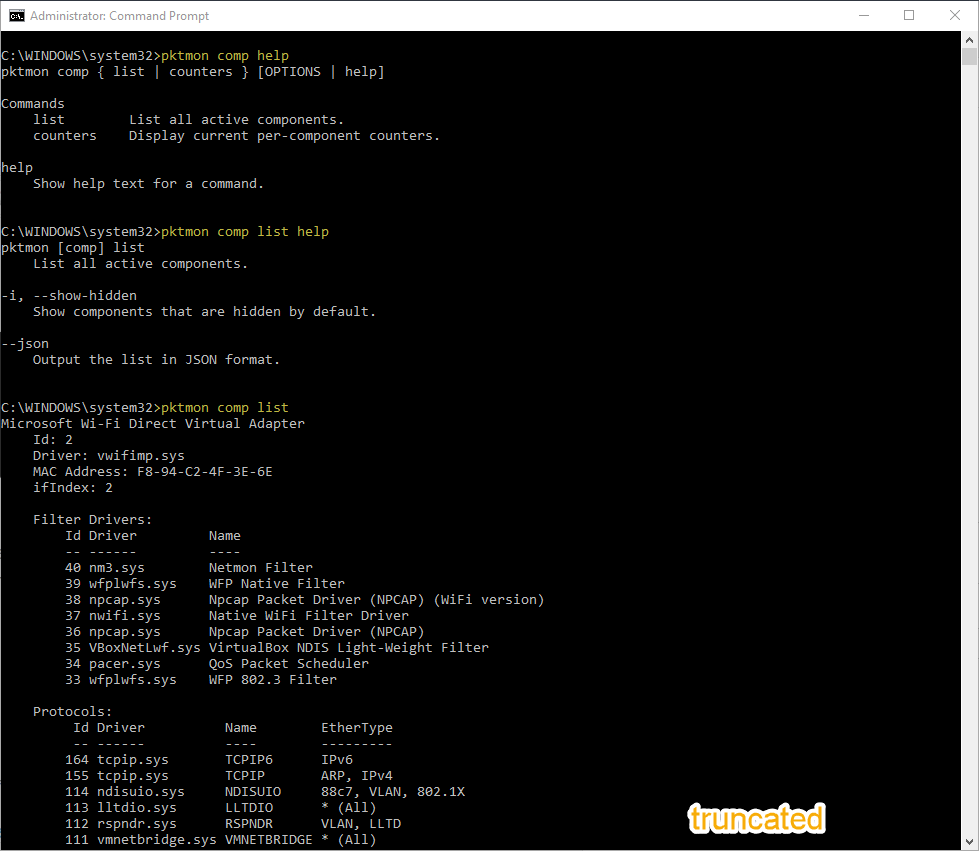
Now, I truncated the output. But you will see in the list that each network adapter in the list has an ID.
I was on my Wi-Fi adapter so I searched to find it’s information (beware of virtual adapters):
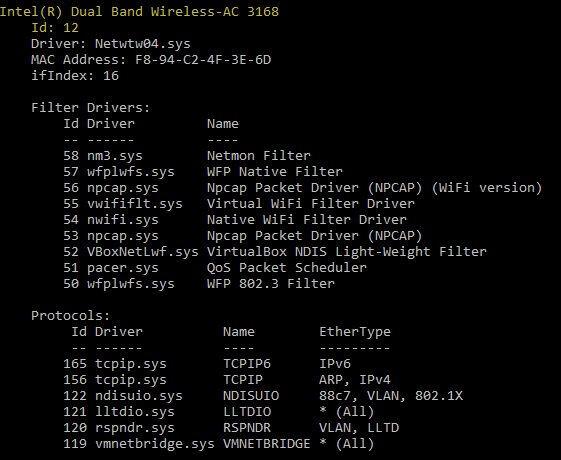
Great, so the ID is 12 on my machine.
So an example command would be:
pktmon start --etw -p 0 -c 12
Another annoyance, there does not appear to be any way to put the Wi-Fi adapter into Monitor Mode either.
I hope this helped you if you have heard of this new tool in Windows. It is a start, but there is no way this is properly baked at this point in time. You are still better off just using Wireshark, or netsh.
Thoughts?
I hope you find this article and its content helpful.
If you would like to help support the continued development of independent networking, broadband, Wi-Fi, VoIP, and packet analysis content, please consider joining our Patreon community where you will gain access to exclusive technical resources, downloadable labs and PCAPs, bonus course content, troubleshooting guides, and additional member-only material. Comments and technical discussion are always welcomed at our Patreon community or on our Discord server. You can also support our work by simply buying us a coffee — every contribution helps us continue creating practical, real-world network science education for professionals and enthusiasts alike.