

Originally published December 12, 2010 | Updated November 4, 2026
Every Windows user has probably opened Task Manager at some point. Perhaps an application stopped responding, the computer became unusually slow, or you simply wanted to find out what was consuming all that CPU or memory.
Task Manager is an excellent utility, and Microsoft has substantially improved it over the years.
But what happens when Task Manager doesn’t provide enough information?
For example, what if you want to determine which process has a particular file open? Or identify which DLLs an application has loaded? Perhaps you want to understand the relationship between multiple processes or investigate something running in the background that you don’t recognize.
That’s where Microsoft Sysinternals Process Explorer comes in.
I first recommended Process Explorer in December 2010. Sixteen years later, it’s still one of my favorite utilities for understanding what’s happening inside a Windows computer.
And the best part? It’s free.
What Is Process Explorer?
Process Explorer is an advanced process inspection and troubleshooting utility developed by Mark Russinovich and maintained as part of Microsoft’s Sysinternals collection. Think of it as Task Manager with considerably more diagnostic information available. It allows you to examine running processes, their relationships to other processes, resource consumption, loaded DLLs, open handles, and other Windows internals.
For technicians, these details can make the difference between guessing what might be wrong and having useful evidence to investigate.
You can download the latest version directly from Microsoft: Download Microsoft Sysinternals Process Explorer
As of November 2026, Microsoft lists version 17.2, released October 15, 2026.
Process Explorer does not require a conventional installation. Download the ZIP archive, extract its contents, and run the appropriate executable, typically procexp64.exe on a 64-bit Windows system.
For complete visibility into system processes, I recommend running Process Explorer as administrator when appropriate.
Why Not Just Use Windows Task Manager?
Modern Windows Task Manager is quite capable.
Press Ctrl + Shift + Esc to open it.
From there, you can examine CPU, memory, disk, and network utilization, inspect individual processes, review startup applications, and examine numerous system performance statistics.
For many problems, that’s all you need.
But Process Explorer goes further.
| Capability | Windows Task Manager | Process Explorer |
|---|---|---|
| View running processes | Yes | Yes |
| Examine CPU and memory usage | Yes | Yes |
| Display process relationships | Limited | Detailed process tree |
| Inspect loaded DLLs | Not directly | Yes |
| Examine open file and object handles | Limited | Yes |
| Search for processes holding a specific file | No direct equivalent | Yes |
| Inspect process threads and stacks | Limited | Detailed inspection |
| Check processes using VirusTotal | No native equivalent | Supported |
I don’t consider Process Explorer a replacement for Task Manager in every situation.
Rather, it’s the tool I reach for when I need to investigate more deeply.
Understanding the Process Tree
One of the first things you’ll notice when opening Process Explorer is the hierarchical display of running processes.
Unlike a simple process list, Process Explorer shows parent-child process relationships. This helps explain how certain processes were created. For example, launching a web browser may create multiple processes associated with rendering, graphics processing, extensions, network services, and other functions.
Process Explorer allows you to expand these relationships and investigate individual processes.
You may discover that what appears to be a single application is actually a collection of processes performing different tasks.
Keep in mind that modern browsers use complex multiprocess architectures. Process Explorer doesn’t necessarily identify exactly which browser tab corresponds to every process. The browser’s own task manager may provide that additional context.
Another caution: the displayed parent-child hierarchy reflects process creation relationships. It doesn’t necessarily mean a parent process is still running or directly controlling everything its descendants do.
Nevertheless, this view is extremely useful when examining how applications operate.
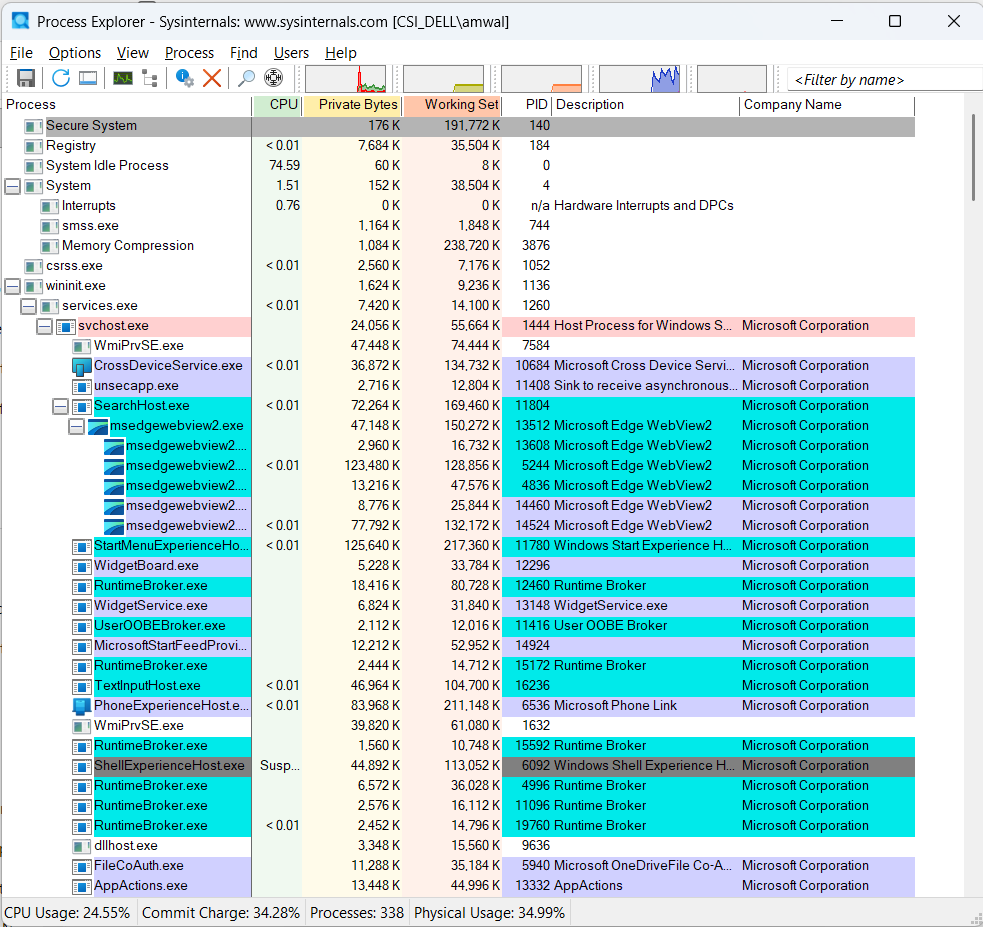
Figure 1: Microsoft Process Explorer displaying running Windows processes and their relationships, along with CPU and memory consumption.
Step 1: Find Out What’s Consuming CPU Resources
Suppose your Windows computer suddenly becomes sluggish. You hear the cooling fan running faster than usual, applications respond slowly, and Task Manager shows unusually high processor utilization. Process Explorer can help identify the responsible process.
Start by examining the CPU column.
You can sort the process list by CPU utilization to identify processes consuming significant processing resources.
If a particular process consistently appears near the top, examine its name, description, publisher, and executable path.
A process temporarily consuming significant CPU resources isn’t necessarily a problem. Software updates, antivirus scans, compression operations, and application initialization may all consume substantial resources legitimately.
What interests me is sustained or unexpected activity that corresponds to the symptoms I’m investigating.
Process Explorer also provides access to individual process properties, including thread information.
For more advanced investigations, the Threads tab can help identify which threads are consuming CPU resources. Stack inspection may provide additional clues about what the threads are doing.
This is considerably more useful than randomly terminating processes because their CPU usage looks high.
Step 2: Investigate Memory Consumption
Memory problems can be equally frustrating.
A computer might become progressively slower over several hours or days, perhaps because an application is accumulating memory allocations it no longer needs.
Process Explorer exposes a variety of memory statistics, including working set and private memory measurements.
These are not interchangeable.
The working set represents pages of a process’s virtual memory that are currently resident in physical memory, including pages that may be shared with other processes.
Private Bytes represents the amount of private committed virtual memory associated with the process. It is not necessarily all resident in physical RAM.
Understanding this distinction matters when investigating possible memory leaks. For example, if an application’s Private Bytes value increases steadily over time, particularly while the application is performing the same workload, that may justify further investigation.
But an increasing memory measurement alone doesn’t prove a leak. Application caching, workload changes, and legitimate allocations can produce similar behavior.
Process Explorer provides useful observations. Interpreting those observations correctly is still the technician’s responsibility.
Step 3: Find Out Which Process Has a File Open
Here’s a situation many Windows users have encountered.
You attempt to delete, rename, or move a file and Windows reports that it cannot complete the operation because the file is being used by another process.
Which process?
Process Explorer provides a particularly useful search capability for investigating this problem.
Open Process Explorer and select: Find → Find Handle or DLL
Alternatively, press Ctrl + F.
Enter part of the file name or path you want to investigate.
Process Explorer searches its available handle and DLL information for matches. For example, suppose you’re attempting to rename a log file but Windows reports that it is in use. Searching for the filename may reveal the process holding an open handle to that file.
You can then determine whether the application should be closed normally or whether another action is appropriate.
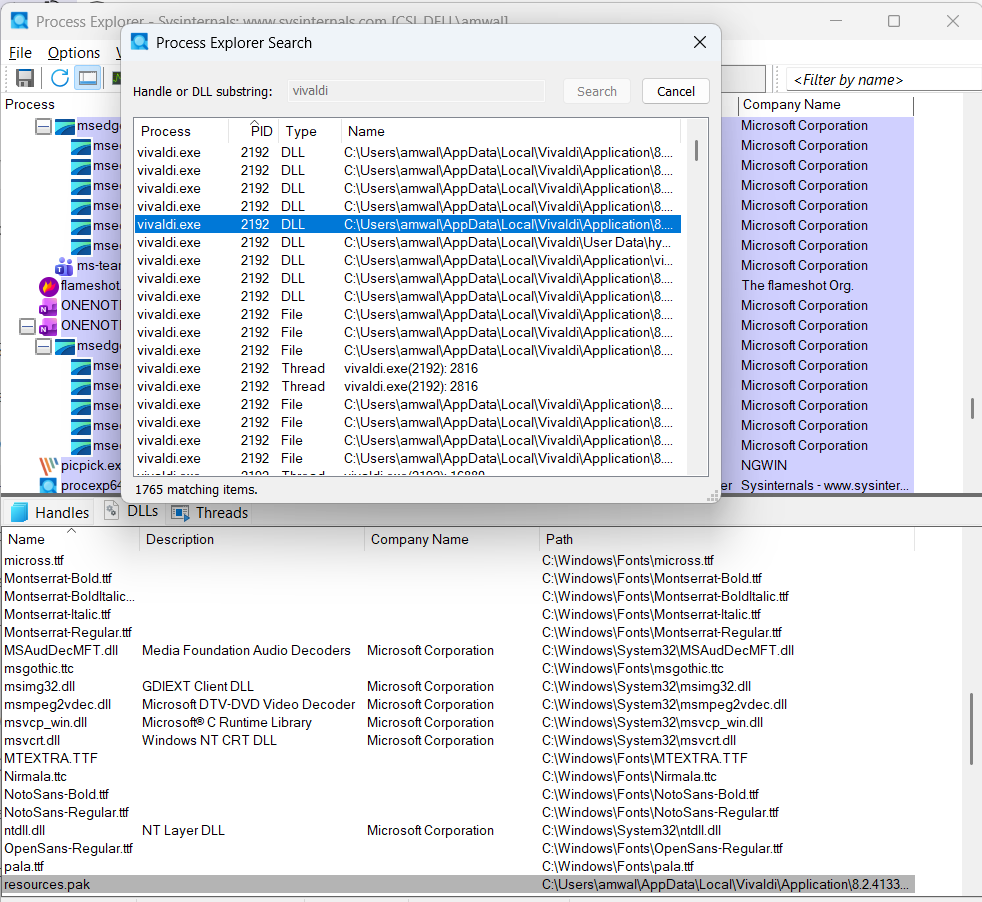
Figure 2: Process Explorer’s Find Handle or DLL feature helps identify which process has a particular file or Windows object open.
Be cautious about forcibly closing handles or terminating processes.
An open file might be associated with an active database, backup operation, application log, or other legitimate system activity.
Forcing it closed can cause data loss, application instability, or other problems.
Whenever possible, close the associated application normally.
Step 4: Examine Loaded DLLs and Other Components
Another interesting feature is the ability to inspect the DLLs loaded by a process.
A DLL, or Dynamic-Link Library, contains code and resources that applications can use.
Windows applications commonly load numerous DLLs associated with the operating system, application frameworks, hardware, security software, and other components.
In Process Explorer, select a process and enable the lower pane using: View → Show Lower Pane
You can then switch between handle and DLL views. This provides additional visibility into the resources associated with the selected process.
Why is this useful? Imagine an application that crashes whenever you attempt to perform a particular operation. You suspect a conflict involving an installed extension, application component, or third-party DLL.
Examining the loaded modules may help identify unexpected components that deserve closer examination.
Process Explorer also provides information about file paths, versions, and publishers that can assist with the investigation.
For additional information on Windows driver troubleshooting, see my recently updated article: Troubleshooting Device Drivers in Windows
Although DLLs and device drivers are different components, both can become important when investigating application instability.
Step 5: Investigate Suspicious Processes
Process Explorer can also be useful during a security investigation.
Suppose you notice a process running with an unfamiliar name. Before assuming it is malicious, examine its properties. Start with the executable path, command line, publisher information, and digital signature. You can also configure Process Explorer to verify digital signatures and integrate with VirusTotal. VirusTotal checks can help identify files that security engines have flagged as potentially malicious.
However, a clean detection result does not guarantee that a process is safe, and an isolated detection does not necessarily prove that it is malicious.
Keep in mind that third-party security lookups may have privacy implications, particularly on business or customer computers. The goal is to gather evidence, not immediately terminate anything unfamiliar. A suspicious process may also have been configured to start automatically. This is where another Microsoft Sysinternals utility becomes useful: Autoruns.
I’ve written a separate article explaining how to use it: Microsoft Autoruns: Troubleshoot Windows Startup Problems
These utilities complement one another.
Process Explorer helps identify and examine processes that are currently running. Autoruns helps identify many of the mechanisms configured to launch programs automatically.
That’s a powerful combination when investigating unwanted software.
Step 6: Examine a Process’s Network Activity
Process Explorer can also provide information about TCP/IP activity associated with a process.
Open the properties of a process and select the TCP/IP tab.
Depending on the process and available information, you can examine network endpoints associated with it.
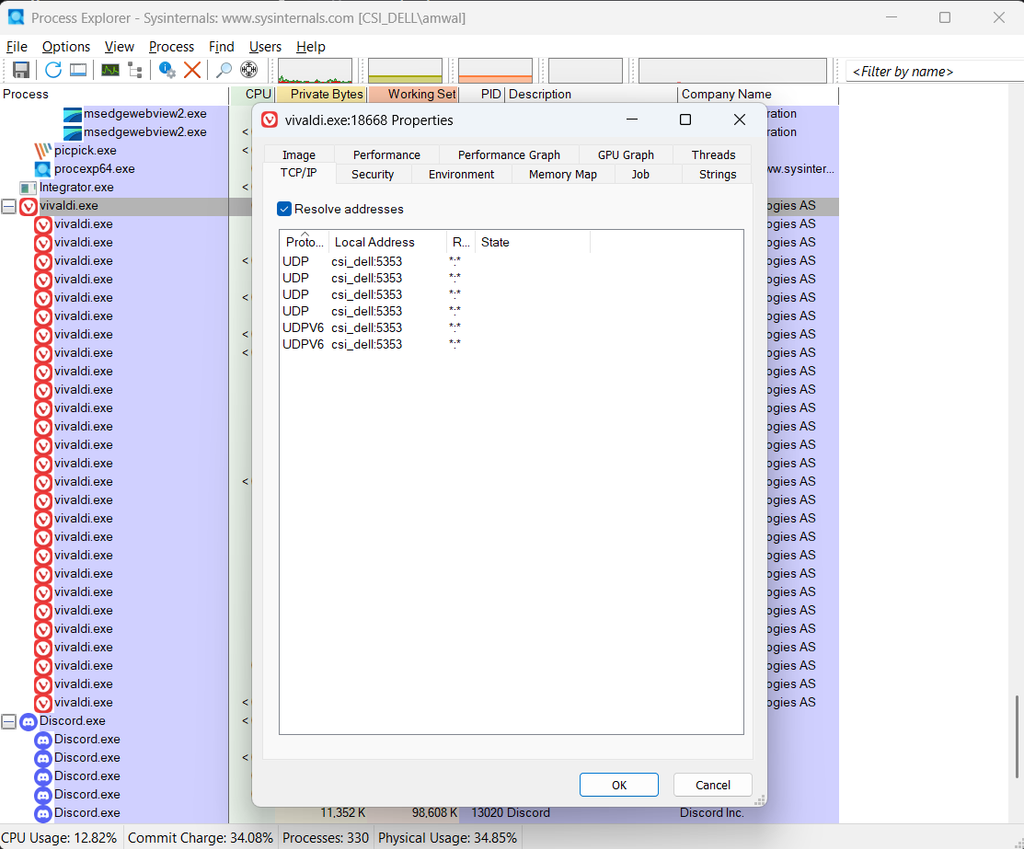
This may help answer questions such as:
- Is this application maintaining network connections?
- Which remote IP addresses or ports are involved?
- Is an unexpected background process communicating across the network?
However, Process Explorer is not a substitute for a dedicated network diagnostic utility or packet analyzer.
For a more focused view of network connections, I recommend Microsoft’s TCPView.
For examining network configuration, addressing, routing, and connectivity, you can also use the free CellStream Windows Networking Toolkit.
And when you need to understand the actual packets being exchanged, Wireshark is the appropriate next step.
Remember that observing a process with an established TCP connection does not automatically tell you whether the application is behaving correctly.
Sometimes you need to examine the TCP handshake, retransmissions, resets, DNS activity, or application protocol exchanges to identify the problem.
Step 7: When Process Explorer Isn’t Enough
Process Explorer is extremely useful, but there are limits to what it can tell you.
It provides a view of processes and their associated resources, but it does not continuously record every file-system or Registry operation performed by an application.
For that level of detail, Microsoft provides another Sysinternals utility called Process Monitor. Download Microsoft Sysinternals Process Monitor
Process Monitor can capture real-time events involving the file system, Registry, process activity, threads, and other operations.
For example, suppose an application fails to start because it cannot access a required Registry key or file. Process Monitor may help reveal the unsuccessful operation.
Process Explorer can tell you which processes are running and what resources they have open. Process Monitor helps show what operations processes are attempting.
Both have an important place in advanced Windows troubleshooting.
One caution: Process Monitor can generate an enormous amount of information very quickly. Configure filters and manage capture duration carefully.
A Practical Troubleshooting Example
Let’s put some of these tools together.
Imagine a Windows 11 computer that begins running slowly shortly after signing in. You open Task Manager and notice sustained CPU activity, but the process name doesn’t explain much.
Here’s how I would investigate.
First, launch Process Explorer and identify which process is consuming CPU resources.
Second, examine its properties. Check the executable path, publisher, command line, and process relationships.
Third, if the CPU activity continues, inspect the process’s threads to narrow down where the processing is occurring.
Fourth, determine whether the process is associated with an application, service, or background task that should be running.
Fifth, if the process appears automatically after every sign-in, use Autoruns to investigate the relevant automatic-start mechanism.
If the evidence points toward a file-access or Registry problem, Process Monitor may provide additional insight.
Notice what we haven’t done. We haven’t randomly disabled services, deleted Registry entries, or terminated a collection of processes in the hope that Windows will suddenly behave better. Instead, we’ve moved from observing a symptom to collecting evidence.
That is a much better troubleshooting workflow.
For additional background, see my article on PC and Network Troubleshooting: Practical Tips and Tools.
Final Thoughts
When I first wrote about Process Explorer in 2010, I described it as a supercharged version of Windows Task Manager. I still think that’s a reasonable description.
Microsoft has significantly improved Task Manager since then, but Process Explorer continues to provide additional visibility into what Windows and its applications are doing. Whether you’re investigating CPU usage, memory consumption, application crashes, locked files, DLL dependencies, or suspicious processes, it’s a tool worth knowing.
For network technicians, understanding the relationship between processes, system resources, and network activity is particularly valuable. Sometimes the apparent network problem isn’t caused by the network at all.
It might be an application that has stopped responding, a process consuming excessive resources, or a software component that isn’t operating as expected. Process Explorer helps us see those things.
And as I’ve said many times in my networking classes, good troubleshooting begins with understanding what is actually happening rather than guessing.
References and Additional Resources
Microsoft resources
- Microsoft Sysinternals Process Explorer
- Microsoft Sysinternals Process Monitor
- Microsoft Sysinternals TCPView
- Microsoft Sysinternals Autoruns
Related CellStream articles
- Microsoft Autoruns: Troubleshoot Windows Startup Problems
- PC and Network Troubleshooting: Practical Tips and Tools
- Troubleshooting Device Drivers in Windows
- Free CellStream Windows Networking Toolkit
If you would like to help support the continued development of independent networking, broadband, Wi-Fi, VoIP, and packet analysis content, please consider joining our Patreon community where you will gain access to exclusive technical resources, downloadable labs and PCAPs, bonus course content, troubleshooting guides, and additional member-only material. Comments and technical discussion are always welcomed at our Patreon community or on our Discord server. You can also support our work by simply buying us a coffee — every contribution helps us continue creating practical, real-world network science education for professionals and enthusiasts alike.