

Originally published May 22, 2020 | Updated November 8, 2026
Back in May 2020, I wrote about a new packet capture utility Microsoft had quietly introduced into Windows 10. It was called Packet Monitor, or pktmon.exe, and it promised something interesting: the ability to capture and troubleshoot network packets without installing additional software.
Naturally, I had to experiment with it.
My initial reaction was mixed. Yes, it could capture packets, but the command-line interface was awkward, the output options were limited, and getting the results into Wireshark was unnecessarily difficult. I ended that original article suggesting that technicians would probably be better off using Wireshark or Netsh.
Well, six years later, Packet Monitor has matured considerably. Microsoft has improved the command structure, added PCAPNG conversion, and expanded its usefulness for examining packet processing and drops within the Windows networking stack.
So let’s revisit Pktmon, walk through a practical capture exercise, and determine where it fits into a network technician’s troubleshooting toolkit.
What Is Windows Packet Monitor?
Packet Monitor is a built-in Windows networking diagnostic utility. It is available on Windows 11 and supported Windows Server versions, and it doesn’t require you to install Wireshark, Npcap, or another packet capture application.
Unlike a traditional packet capture tool that primarily collects traffic at a network interface, Pktmon can observe packets at multiple locations within the Windows networking stack.
Why does that matter?
Consider a packet arriving at a Windows computer. It may pass through several networking components, including the network adapter driver, filtering components, virtual switches, and other elements before reaching its destination.
If a packet is being dropped somewhere within that processing path, capturing traffic at only one location may not reveal where the problem occurred.
Pktmon can help investigate that distinction by providing packet counters, monitoring at different processing components, and reporting some packet drop reasons.
This makes it particularly interesting for troubleshooting Windows networking, Hyper-V virtual switches, containers, and other environments where packet processing involves multiple software components.
Microsoft documents these capabilities in its Packet Monitor Overview.
Getting Started
For this exercise, we’ll use Windows 11 and an elevated Command Prompt.
Right-click the Windows Start button and select Terminal (Admin), or search for Command Prompt and choose Run as administrator.
Let’s create a directory for our experiment:
mkdir C:\Captures
cd C:\Captures
Pktmon is included with Windows, so there’s nothing additional to download.
Start by entering:
pktmon helpThis displays the available commands.
You should see commands associated with filters, components, packet capture, counters, and file conversion.
For additional information about any command, use its help option. For example:
pktmon start helpOr:
pktmon filter add helpI complained about this help system in my original article, and while it still requires some exploration, the commands are now considerably easier to understand.
Step 1: Examine the Network Components
Before capturing anything, let’s examine the networking components Pktmon can monitor.
Enter:
pktmon listThis displays the available network adapters and their component identifiers.
For a broader view, try:
pktmon list --allThe additional output may include networking components associated with virtual switches, filter drivers, and other elements in the networking stack.
Each monitored component has an identifier that can be used when selecting where to capture packets.
This is an important distinction from Wireshark.
When we select an interface for a conventional Wireshark capture, we’re generally choosing an interface exposed through the packet capture driver. Pktmon provides the ability to observe packets at multiple Windows networking components.
For a computer with virtualization software, VPN adapters, or several physical interfaces, the list can be extensive.
Microsoft Windows [Version 10.0.26300.9711]
(c) Microsoft Corporation. All rights reserved.

C:\Windows\System32>pktmon list --all
NIC: Bluetooth Device (Personal Area Network)
Id: 11
Driver: bthpan.sys
MAC Address: 68-3E-26-EB-E8-16
ifIndex: 3

Filter Drivers:
    Id Driver      Name
    -- ------      ----
    78 npcap.sys   Npcap Packet Driver (NPCAP)
    35 ndiscap.sys Microsoft NDIS Capture
    34 ndiscap.sys Microsoft NDIS Capture

Protocols:
     Id Driver      Name    EtherType
     -- ------      ----    ---------
    131 tcpip.sys   TCPIP6  IPv6
    132 tcpip.sys   TCPIP   IPv4, ARP
    129 lltdio.sys  LLTDIO  * (All)
    123 rspndr.sys  RSPNDR  VLAN, LLTD
    122 ndisuio.sys NDISUIO VLAN, 802.1X, 802.11i

Application Protocols:
     Id Driver   Name IP Address
     -- ------   ---- ----------
    179 http.sys HTTP fe80::xxxxxxxxxxxxx
    167 http.sys HTTP 169.254.35.88

NIC: Intel(R) Wi-Fi 6 AX201 160MHz
Id: 13
Driver: Netwtw10.sys
MAC Address: 68-3E-26-EB-E8-12
ifIndex: 9

Filter Drivers:
    Id Driver         Name
    -- ------         ----
    77 wfplwfs.sys    WFP Native Filter
    76 vwififlt.sys   Virtual WiFi Filter Driver
    75 nwifi.sys      Native WiFi Filter Driver
    74 npcap.sys      Npcap Packet Driver (NPCAP)
    73 VBoxNetLwf.sys VirtualBox NDIS Light-Weight Filter
    72 pacer.sys      QoS Packet Scheduler
    71 wfplwfs.sys    WFP 802.3 Filter
    27 ndiscap.sys    Microsoft NDIS Capture
    26 ndiscap.sys    Microsoft NDIS Capture
    25 ndiscap.sys    Microsoft NDIS Capture
    24 ndiscap.sys    Microsoft NDIS Capture
    23 ndiscap.sys    Microsoft NDIS Capture
    22 ndiscap.sys    Microsoft NDIS Capture
    21 ndiscap.sys    Microsoft NDIS Capture
    20 ndiscap.sys    Microsoft NDIS Capture

Protocols:
     Id Driver      Name    EtherType
     -- ------      ----    ---------
    118 tcpip.sys   TCPIP6  IPv6
    119 tcpip.sys   TCPIP   IPv4, ARP
    117 rspndr.sys  RSPNDR  VLAN, LLTD
    116 ndisuio.sys NDISUIO VLAN, 802.1X, 802.11i
    115 lltdio.sys  LLTDIO  * (All)

Application Protocols:
     Id Driver   Name IP Address
     -- ------   ---- ----------
    171 http.sys HTTP fe80::xxxxxxxxxxxxx
    164 http.sys HTTP 169.254.125.231

NIC: VirtualBox Host-Only Ethernet Adapter
Id: 14
Driver: VBoxNetAdp6.sys
MAC Address: 0A-00-27-00-00-0D
ifIndex: 13

Filter Drivers:
    Id Driver      Name
    -- ------      ----
    87 wfplwfs.sys WFP Native Filter
    86 npcap.sys   Npcap Packet Driver (NPCAP)
    85 pacer.sys   QoS Packet Scheduler
    84 wfplwfs.sys WFP 802.3 Filter
    19 ndiscap.sys Microsoft NDIS Capture
    18 ndiscap.sys Microsoft NDIS Capture
    17 ndiscap.sys Microsoft NDIS Capture
    16 ndiscap.sys Microsoft NDIS Capture
    15 ndiscap.sys Microsoft NDIS Capture

Protocols:
     Id Driver      Name    EtherType
     -- ------      ----    ---------
    135 tcpip.sys   TCPIP6  IPv6
    136 tcpip.sys   TCPIP   IPv4, ARP
    128 lltdio.sys  LLTDIO  * (All)
    126 mslldp.sys  MSLLDP  LLDP
    124 rspndr.sys  RSPNDR  VLAN, LLTD
    120 ndisuio.sys NDISUIO VLAN, 802.1X, 802.11i

Application Protocols:
     Id Driver   Name IP Address
     -- ------   ---- ----------
    182 http.sys HTTP fe80::xxxxxxxxxxxxx
    170 http.sys HTTP 192.168.56.1

NIC: Realtek USB GbE Family Controller
Id: 12
Driver: rtump64x64.sys
MAC Address: 00-E0-4C-11-2C-40
ifIndex: 16

Filter Drivers:
    Id Driver         Name
    -- ------         ----
    83 wfplwfs.sys    WFP Native Filter
    82 npcap.sys      Npcap Packet Driver (NPCAP)
    81 VBoxNetLwf.sys VirtualBox NDIS Light-Weight Filter
    80 pacer.sys      QoS Packet Scheduler
    79 wfplwfs.sys    WFP 802.3 Filter
    33 ndiscap.sys    Microsoft NDIS Capture
    32 ndiscap.sys    Microsoft NDIS Capture
    31 ndiscap.sys    Microsoft NDIS Capture
    30 ndiscap.sys    Microsoft NDIS Capture
    29 ndiscap.sys    Microsoft NDIS Capture
    28 ndiscap.sys    Microsoft NDIS Capture

Protocols:
     Id Driver      Name    EtherType
     -- ------      ----    ---------
    133 tcpip.sys   TCPIP6  IPv6
    134 tcpip.sys   TCPIP   IPv4, ARP
    130 lltdio.sys  LLTDIO  * (All)
    127 mslldp.sys  MSLLDP  LLDP
    125 rspndr.sys  RSPNDR  VLAN, LLTD
    121 ndisuio.sys NDISUIO VLAN, 802.1X, 802.11i

Application Protocols:
     Id Driver   Name IP Address
     -- ------   ---- ----------
    178 http.sys HTTP fe80::xxxxxxxxxxxxx
    177 http.sys HTTP fd00:xxxxxxxxxxxxx
    176 http.sys HTTP fd00:xxxxxxxxxxxxx
    175 http.sys HTTP 2603:xxxxxxxxxxxxx
    174 http.sys HTTP 2603:xxxxxxxxxxxxx
    173 http.sys HTTP 2603:xxxxxxxxxxxxx
    166 http.sys HTTP 192.168.1.225

HTTP Message
Id: 183
Driver: HTTP.SYS

IPSEC
Id: 163
Driver: tcpip.sys

C:\Windows\System32>
Packet Monitor displaying the available Windows networking components and their identifiers. These identifiers can be used to select specific packet capture locations. I used ‘xxxxxxxxxxxxx’ to remove sensitive address info above.
Step 2: Clear Any Previous Capture Filters
Before starting a new capture, I recommend removing any filters left over from previous experiments.
Enter:
pktmon filter removeThis removes the configured Pktmon packet filters.
We can verify the result with:
pktmon filter listWhy bother?
Because it’s frustrating to start a capture, generate traffic, and later discover that an old filter prevented the packets you wanted from being recorded.
Pktmon’s filters determine which packets qualify for collection. If no filters are configured, the capture is not restricted by a Pktmon packet filter.
For our first experiment, we’ll collect a broad sample of traffic and narrow our analysis afterward in Wireshark.
Step 3: Start Capturing Packets
Now let’s collect some packets.
Enter the following command:
pktmon start --capture --comp nics --pkt-size 0 --file-name C:\Captures\PktMon.etlLet’s examine the options.
| Parameter | Purpose |
|---|---|
start | Begins the monitoring session |
--capture | Enables packet capture and packet counters |
--comp nics | Limits packet collection to network interface components |
--pkt-size 0 | Requests the entire packet rather than truncating it |
--file-name | Specifies the output ETL file |
Notice the --pkt-size 0 option.
By default, Pktmon captures only the first 128 bytes of each packet. That can be useful for examining headers, but it may prevent us from seeing information deeper in a packet.
Setting the packet size to zero requests full packets at the selected capture points.
For troubleshooting and protocol analysis, that is often preferable, although it can result in larger capture files.
We’ve also selected --comp nics to keep the first exercise relatively simple. This avoids collecting the same traffic at every available component within the Windows networking stack.
We’ll explore the more advanced component-monitoring capabilities later.
If the command succeeds, Pktmon should indicate that packet monitoring has started.
Step 4: Generate Some Network Traffic
Now we need something to capture.
Open another Command Prompt and enter:
ping 1.1.1.1Next, generate a DNS query:
nslookup www.cellstream.comFinally, try:
curl.exe -4 -I https://www.cellstream.com/This requests HTTP response headers from the CellStream website over IPv4.
Assuming the connections succeed, these operations should generate several types of traffic, including ICMP, DNS, TCP, and TLS.
Depending on your DNS resolver configuration, DNS queries may be sent using IPv4 or IPv6, and possibly through a different transport than you expect.
One of the advantages of a simple experiment like this is that you know what traffic you attempted to generate. That gives you something specific to look for when analyzing the resulting capture.
Step 5: Examine Packet Counters
While the capture is running, return to your elevated Command Prompt.
Enter:
pktmon countersThis displays packet counters for the monitored components.
You can also request a continuously updated display:
pktmon counters --livePress Ctrl + C to stop the live counter display without stopping the packet capture session.
This is a useful feature because it provides information about packet activity without requiring you to open and analyze the capture file.
If you’re investigating packet drops, try:
pktmon counters --type drop --drop-reasonThe output can help identify whether monitored Windows components are reporting packet drops and, where supported, provide information about the reasons.
Keep in mind that a packet counter isn’t necessarily the same thing as a count of unique packets on the physical network. When monitoring multiple processing components, the same packet may be observed more than once.
That distinction becomes important when interpreting the results.
Step 6: Stop the Capture
Once you’ve generated enough traffic, stop the monitoring session:
pktmon stopThen examine the output directory:
dir C:\CapturesYou should find the ETL file created during the capture.
For our example:
C:\Captures\PktMon.etl
An ETL file is an Event Trace Log produced through Windows Event Tracing technology. It can contain packet information and other diagnostic details associated with the tracing session.
This brings us to the biggest improvement since my original 2020 article.
Step 7: Convert the Capture to PCAPNG
In the original article, I struggled to find a practical way to examine the captured packets in Wireshark.
At the time, Pktmon could convert its ETL data to text, but there was no convenient built-in PCAPNG export option in the version I was testing.
That has changed.
Today, Pktmon includes its own PCAPNG conversion utility.
Enter:
pktmon etl2pcap C:\Captures\PktMon.etl --out C:\Captures\PktMon.pcapngThe command converts supported packet information from the ETL file into PCAPNG format.
That’s it.
You should now have:
C:\Captures\PktMon.pcapng
No separate converter is required for the ordinary Pktmon workflow.
This is a substantial improvement over the version I tested in 2020.
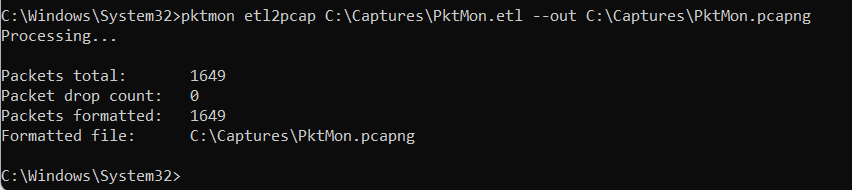
Using Pktmon’s built-in etl2pcap command to convert a Windows ETL capture into PCAPNG for Wireshark analysis.
An Important Limitation
There is one detail worth understanding.
PCAPNG conversion does not preserve all the diagnostic information available in the original ETL file. In particular, information about packet processing through the Windows networking stack and packet drop reports is not fully represented in the converted capture.
For that reason, I recommend retaining the original ETL file when investigating internal packet processing or packet drops.
Use the PCAPNG file for protocol analysis, and the ETL file when the Windows-specific diagnostic information is important.
Step 8: Analyze the Capture in Wireshark
Now launch Wireshark and open:
C:\Captures\PktMon.pcapng
If everything worked correctly, you’ll see the packets captured during the experiment.
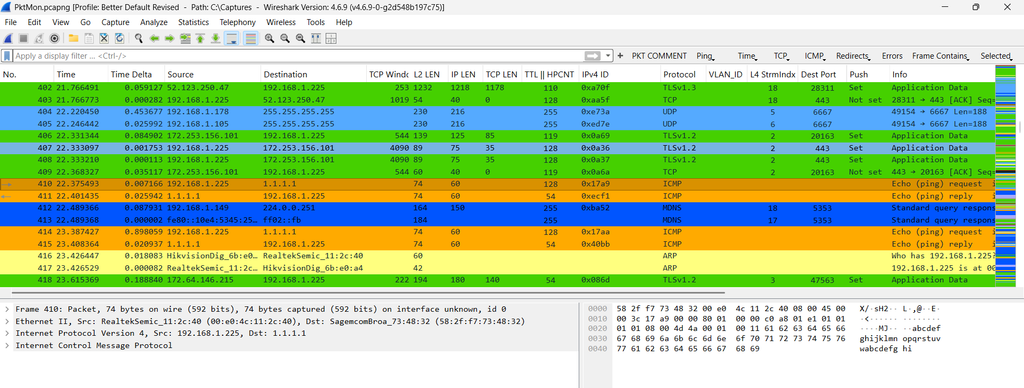
Try these Wireshark display filters:
| Objective | Display Filter |
|---|---|
| ICMPv4 traffic | icmp |
| DNS traffic | dns |
| TCP traffic | tcp |
| TLS traffic | tls |
| IPv6 traffic | ipv6 |
| Packets involving 1.1.1.1 | ip.addr == 1.1.1.1 |
| TCP SYN packets | tcp.flags.syn == 1 |
For a broader view of what was captured, try Statistics → Protocol Hierarchy or Statistics → Conversations.
These features can help identify which protocols and endpoints were present in the capture.
You can also examine the TCP three-way handshake associated with the HTTPS connection and investigate the TLS exchange.
Of course, the HTTPS application data will normally be encrypted.
The important point is that the packet analysis workflow is now straightforward.
We can capture using a tool already included with Windows, convert to PCAPNG, and perform detailed protocol analysis using Wireshark.
For additional Wireshark analysis resources, visit the CellStream Wireshark Profiles Repository.
Step 9: Add a Packet Capture Filter
Now let’s make the experiment more selective.
Suppose we want to collect only traffic associated with TCP port 443.
First, make sure no previous capture is running, then remove any existing filters:
pktmon filter removeNext, create a new filter:
pktmon filter add HTTPS -t TCP -p 443The filter name, HTTPS, is simply a label.
The -t TCP option specifies the transport protocol, while -p 443 matches traffic using TCP port 443.
Verify the filter:
pktmon filter listNow start another capture:
pktmon start --capture --comp nics --pkt-size 0 --file-name C:\Captures\HTTPS.etlGenerate some HTTPS traffic:
curl.exe -4 -I https://www.cellstream.com/Then stop the capture:
pktmon stopConvert the file:
pktmon etl2pcap C:\Captures\HTTPS.etl --out C:\Captures\HTTPS.pcapngOpen it in Wireshark.
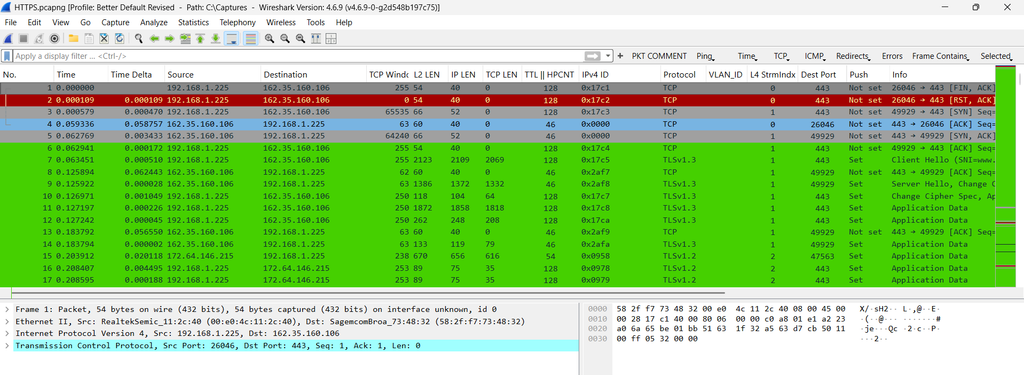
You should see traffic matching the configured filter, assuming the connection succeeded and the capture point observed the traffic.
A useful technical distinction: TCP port 443 is not synonymous with all HTTPS traffic. Modern browsers may use HTTP/3 over QUIC, which normally operates over UDP port 443.
Our filter deliberately selects TCP traffic, so it will not capture UDP-based QUIC connections.
If you wanted to include both TCP and UDP port 443, you could instead configure a port-only filter:
pktmon filter add Web443 -p 443Remember that Pktmon capture filters and Wireshark display filters use different syntax.
And don’t forget to remove your filters after the experiment:
pktmon filter removeStep 10: Investigate Packet Drops
Here’s where Packet Monitor becomes especially interesting.
A traditional packet capture can reveal that expected traffic is missing or that an endpoint retransmits packets. But it may not tell us where an inbound packet was discarded inside the Windows networking stack.
Pktmon can monitor multiple processing components and report certain packet drops.
For a broader investigation, start with:
pktmon list --allThis displays the components available for monitoring.
Then start a capture without restricting monitoring to only network adapters:
pktmon start --capture --comp all --pkt-size 0 --file-name C:\Captures\StackTrace.etlThis can generate considerably more data because packets may be observed at multiple locations within the stack.
Reproduce the suspected networking problem, then examine the counters:
pktmon counters --type drop --drop-reasonWhen finished:
pktmon stopNow convert the original ETL file into readable text:
pktmon etl2txt C:\Captures\StackTrace.etl --out C:\Captures\StackTrace.txtExamine the text file for packet-processing information and reported drops.
For a more focused examination, Microsoft also provides options for selecting particular component IDs when converting packet information.
Why This Matters
Suppose a packet arrives at a Windows network adapter but fails to reach the intended application.
Is the packet being dropped by a firewall rule, a network filter, a virtual switch, or another component?
Pktmon may help narrow down where the packet stopped progressing and identify a reported reason for the drop.
That can provide information that isn’t obvious from a traditional packet capture.
However, don’t assume that every reported packet drop represents a network fault. Some drops are expected or intentional, such as traffic rejected by a security policy.
The challenge is determining whether the observed drop corresponds to the communication problem you’re investigating.
This is one of the most compelling reasons to learn Pktmon rather than treating it as simply another way to generate PCAPNG files.
Step 11: Capturing Traffic from a Specific Component
In my original 2020 article, I spent considerable time trying to identify the correct network adapter component.
That remains relevant.
Suppose your computer has multiple interfaces, including Ethernet, Wi-Fi, VPN, and virtual network adapters. You may want to capture traffic associated with one particular component.
Start by listing the components:
pktmon list --allLocate the relevant adapter or networking component and record its identifier.
Then use the --comp option when starting the capture.
For example, if the component ID is 12:
pktmon start --capture --comp 12 --pkt-size 0 --file-name C:\Captures\Adapter12.etlThis restricts monitoring to the selected component.
Of course, the component ID will vary between computers, and you should not assume that the ID remains consistent after significant networking configuration changes.
This technique can be useful when trying to distinguish traffic associated with a physical network adapter from traffic involving VPN or virtual networking components.
Step 12: Can Pktmon Capture Raw Wi-Fi Frames?
Here’s another limitation I raised in 2020.
If the Windows computer uses a Wi-Fi adapter, Pktmon can observe network traffic associated with that interface.
However, that doesn’t automatically mean you’re capturing raw IEEE 802.11 management, control, and data frames in monitor mode.
There is a major difference between capturing IP traffic passing through a Wi-Fi connection and capturing the actual 802.11 wireless frames transmitted over the air.
For example, examining association exchanges, beacon frames, probe requests, and detailed wireless frame behavior generally requires an appropriate adapter, driver, and capture mechanism.
Pktmon should not be considered a substitute for proper 802.11 monitor-mode packet capture.
I’ve explored that subject in more detail in my article: Capturing Wi-Fi/WLAN Packets on Windows for Free
Packet Monitor Versus Netsh Trace
Since we’ve recently updated my article on using Netsh for Windows packet capture, this comparison is worth including.
Both tools are included with Windows and can collect network diagnostic information without requiring Wireshark on the target computer.
But there are differences.
| Capability | Pktmon | Netsh Trace |
|---|---|---|
| Built into Windows | Yes | Yes |
| Command-line packet capture | Yes | Yes |
| Output capture format | ETL | ETL |
| Built-in PCAPNG conversion | Yes | No |
| External PCAPNG converter | Not normally required | ETL2PCAPNG |
| Packet drop counters | Yes | Not equivalent |
| Multiple stack capture points | Yes | Different tracing model |
| Windows diagnostic tracing | Yes | Yes |
| Suitable for later Wireshark analysis | Yes | Yes, after conversion |
If I simply need a conventional packet capture and Wireshark isn’t installed, either approach may be suitable.
Pktmon has the advantage of built-in PCAPNG conversion and additional packet-processing diagnostics.
Netsh Trace offers a different set of Windows tracing scenarios and diagnostic options, making it useful when investigating broader networking behavior.
You can work through the Netsh procedure in my recently updated article: Capturing Network Packets in Windows Using Netsh
A Quick Reference for Pktmon Commands
| Objective | Command |
|---|---|
| Display help | pktmon help |
| List network adapters | pktmon list |
| List network components | pktmon list --all |
| Display filters | pktmon filter list |
| Remove filters | pktmon filter remove |
| Filter TCP port 443 | pktmon filter add HTTPS -t TCP -p 443 |
| Start a packet capture | pktmon start --capture |
| Capture at network adapters only | pktmon start --capture --comp nics |
| Capture full packets | pktmon start --capture --pkt-size 0 |
| Display capture status | pktmon status |
| Display packet counters | pktmon counters |
| Display drop counters | pktmon counters --type drop --drop-reason |
| Stop capture | pktmon stop |
| Convert ETL to PCAPNG | pktmon etl2pcap PktMon.etl --out PktMon.pcapng |
| Convert ETL to text | pktmon etl2txt PktMon.etl --out PktMon.txt |
These are the commands I would concentrate on learning first. Additional filtering and tracing options are available in Microsoft’s documentation.
Important Limitations and Considerations
Before concluding, a few practical cautions are worth mentioning.
Pktmon is not a replacement for Wireshark. It is a capture and Windows network diagnostics tool. Wireshark provides a far richer environment for protocol dissection, conversation analysis, filtering, statistics, and packet interpretation.
Host-side captures don’t necessarily represent exactly what appeared on the physical network. Checksum offloading, segmentation offloading, and other Windows networking operations can affect how packets appear when captured at different processing points.
Capturing at multiple components may produce multiple observations of the same packet. That’s useful for examining packet flow within Windows, but it can be misleading if you interpret every observation as a separate transmission on the wire.
Capture files can contain sensitive information. Even encrypted traffic may reveal IP addresses, DNS queries, hostnames, and connection metadata. Full-packet captures may also include unencrypted application data.
Finally, avoid leaving packet monitoring running longer than necessary. Large or high-volume captures can consume disk space and system resources, particularly when monitoring many components simultaneously.
Final Thoughts
When I first examined Pktmon in 2020, I wasn’t especially impressed. The tool had potential, but the command-line interface was awkward and getting the results into Wireshark was more difficult than it should have been.
Microsoft has made meaningful improvements since then.
The addition of built-in PCAPNG conversion alone makes Pktmon much more practical for technicians. But I think its real value lies in something more interesting: the ability to examine packet activity and drops at different points within the Windows networking stack.
That’s a capability worth exploring, particularly when troubleshooting virtual networking, filtering, and problems that aren’t easily explained by a conventional packet capture.
Will I stop using Wireshark? Absolutely not.
But Pktmon deserves a place in the Windows network troubleshooting toolkit, alongside Netsh, TCPView, Process Explorer, and other diagnostic utilities.
And as always, remember that collecting packets is only part of the process.
Understanding what those packets tell us—and where they were observed—is what makes packet analysis useful.
References and Additional Resources
Microsoft documentation
- Microsoft Packet Monitor Overview
- Pktmon Command Reference
- Pktmon Start Command
- Pktmon Packet Filters
- Pktmon ETL to PCAPNG Conversion
- Pktmon Packet Counters
Related CellStream articles
- Using Netsh to Capture Packets in Windows
- The Netsh Scripting Tool in Windows
- Capturing Wi-Fi/WLAN Packets on Windows for Free
- CellStream Wireshark Profiles Repository
- CellStream Windows Networking Toolkit
If you would like to help support the continued development of independent networking, broadband, Wi-Fi, VoIP, and packet analysis content, please consider joining our Patreon community where you will gain access to exclusive technical resources, downloadable labs and PCAPs, bonus course content, troubleshooting guides, and additional member-only material. Comments and technical discussion are always welcomed at our Patreon community or on our Discord server. You can also support our work by simply buying us a coffee — every contribution helps us continue creating practical, real-world network science education for professionals and enthusiasts alike.