

Originally published January 11, 2017 | Updated November 8, 2026
Did you know that Windows includes a built-in capability for capturing network packets without installing Wireshark, Npcap, or another packet capture application?
It’s true, and it has been available for quite a few years.
Back in January 2017, I wrote about using the Windows Network Shell utility, better known as netsh, to capture packets directly from the command line. The process was straightforward, but there was one frustrating complication: the resulting capture file wasn’t something Wireshark could open directly.
At the time, we needed additional Microsoft software to convert the captured data into a format that Wireshark understood.
Fortunately, the tools have improved. Today, we can capture packets using Netsh, convert the results to PCAPNG, and analyze them in Wireshark without relying on Microsoft’s discontinued packet analysis applications.
Let’s walk through the process on a modern Windows 11 computer.
Why Capture Packets Using Netsh?
If you’re a regular CellStream visitor, you already know that Wireshark is my preferred tool for packet analysis. It’s an exceptionally capable application, and I’ve spent years teaching technicians how to use it for network troubleshooting.
But there are situations where Wireshark isn’t available.
Perhaps you’re troubleshooting a customer’s Windows computer and don’t have permission to install additional software. Maybe you’re working on a server where installing unnecessary applications is discouraged, or you simply need to collect a capture and analyze it later on a different computer.
That’s where Netsh becomes useful.
Netsh is included with Windows and provides commands for examining and configuring numerous networking components. One of its capabilities is network tracing through the netsh trace context.
When packet capture is enabled, Netsh can collect network traffic along with Windows diagnostic events.
These are not necessarily the same thing. Packet data contains captured network traffic, while trace events provide information generated by Windows networking components. Both can be useful when investigating a problem, but they require different analysis techniques.
If you’d like additional background on the utility, see my companion article: The Netsh Shell/Scripting Tool in Windows
Step 1: Open an Administrator Command Prompt
Our first task is to open an elevated Command Prompt.
In Windows 11, right-click Start and select Terminal (Admin), or search for Command Prompt and choose Run as administrator.
The examples in this article use Command Prompt syntax, although Netsh can also be executed from PowerShell.
Before beginning, create a directory to hold the capture files:
mkdir C:\CapturesThis gives us a convenient location for collecting the results instead of placing diagnostic files directly in the root of the C: drive.
Next, examine the Netsh tracing options:
netsh trace start /?You should see a variety of parameters controlling how network tracing operates.
These include options for enabling packet capture, choosing the output filename, managing file sizes, selecting tracing scenarios, and controlling the contents of the collected information.
You can also examine the available tracing scenarios:
netsh trace show scenariosFor this exercise, we’ll keep things simple and perform a basic packet capture without selecting a specialized scenario.
Step 2: Start a Packet Capture
Now for the interesting part.
Enter the following command:
netsh trace start capture=yes report=no tracefile="C:\Captures\nettrace.etl" maxsize=256 filemode=circularIf the command succeeds, Windows will indicate that a tracing session has started.
Let’s examine what we’ve requested.
| Parameter | Purpose |
|---|---|
capture=yes | Enables packet capture |
report=no | Disables generation of the additional diagnostic report |
tracefile= | Specifies the output ETL filename |
maxsize=256 | Sets the trace file size limit to 256 MB |
filemode=circular | Allows older trace data to be overwritten when the configured limit is reached |
Why use circular mode?
Suppose you’re investigating an intermittent network problem. You may need to leave the capture running until the issue occurs, but you don’t want the trace file growing indefinitely.
Circular mode provides a way to limit the amount of stored data.
Of course, this also means older packets may be overwritten. Once the problem occurs, you should stop the trace as soon as practical to preserve the relevant information.
One other point: the ETL extension is intentional.
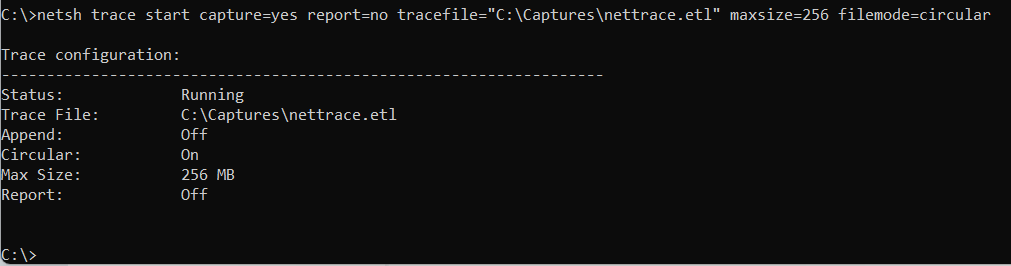
Starting a Windows network packet capture using Netsh. The trace runs in the background and writes its data to an ETL file.
Step 3: Generate Some Network Traffic
With the trace running, let’s generate a little traffic that we can investigate later.
Open a second Command Prompt or Windows Terminal session.
Try:
ping 1.1.1.1Then:
nslookup www.cellstream.comFinally, open your browser and visit: https://www.cellstream.online
These operations should generate several different types of network traffic, including ICMP Echo Requests and Replies, DNS activity, and web traffic.
Depending on the browser and network configuration, the web connection may use TCP and TLS or UDP and QUIC.
This is one reason I like using actual network traffic for packet capture exercises. Even a simple web visit can involve several protocols.
For a more controlled experiment, you can use:
curl.exe -4 -I https://www.cellstream.com/This requests the HTTP response headers over an IPv4 connection.
The traffic should include the necessary connection establishment and protocol exchanges, assuming the connection succeeds.
Remember that modern HTTPS traffic is encrypted. Capturing the packets does not automatically give you access to the encrypted application data.
Step 4: Verify the Trace Is Running
Before stopping the capture, you can check its status:
netsh trace show statusThis displays information about the current tracing session.
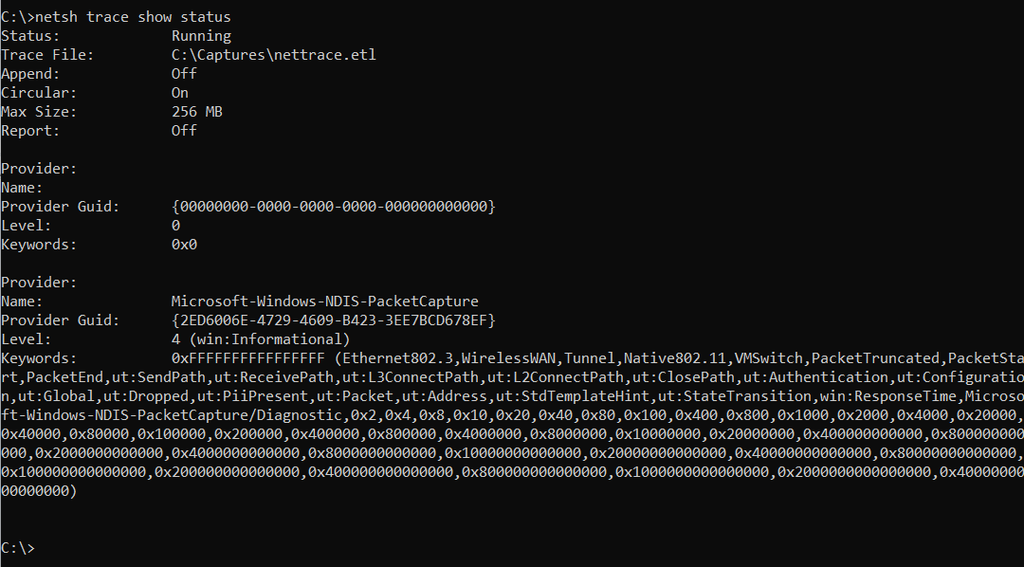
It’s useful when you’ve started a trace and want to confirm that Windows is still collecting information.
This becomes particularly important when troubleshooting intermittent problems or working on a remote computer.
You don’t want to spend an hour reproducing a problem only to discover that the trace never started.
Step 5: Stop the Packet Capture
Once you’ve generated the traffic you want to examine, return to your elevated Command Prompt and enter:
netsh trace stopWindows will stop the tracing session and finalize the collected information.
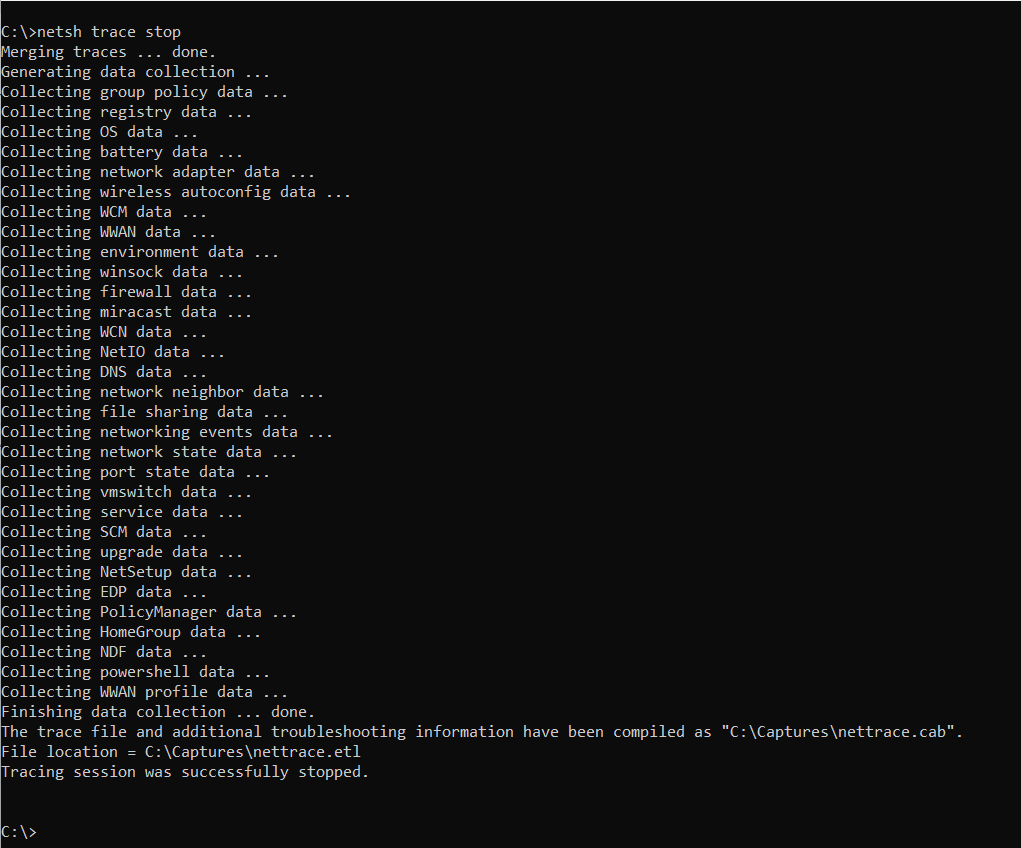
Depending on the amount of data and the tracing configuration, this operation may take some time.
Don’t terminate the command or power down the computer while Windows is finalizing the trace.
When the operation completes, examine the contents of:
C:\Captures
You should find the ETL file created by the tracing session.
Depending on the configuration, Windows may also generate additional diagnostic files.
The important file for our packet analysis exercise is:
nettrace.etl
Step 6: Understanding the ETL File
Here is where the original 2017 procedure became a little frustrating.
Netsh creates an Event Trace Log, or ETL, file. ETL is a Windows event-tracing format used to store diagnostic information collected through Event Tracing for Windows (ETW).
It is not the same thing as a conventional PCAP or PCAPNG packet capture file.
The ETL file may contain packet-capture events as well as information from Windows diagnostic providers. Wireshark does not ordinarily open these Netsh-generated ETL files directly as conventional packet captures.
Back in 2017, I recommended converting the results using Microsoft Network Monitor or Microsoft Message Analyzer.
Microsoft Message Analyzer has since been retired, and Microsoft Network Monitor is no longer actively developed.
Fortunately, there is now a much better conversion option.
Step 7: Convert the ETL Capture to PCAPNG
Microsoft maintains an open-source utility called ETL2PCAPNG.
It is designed to convert packet capture information from Windows ETL files into PCAPNG, a format supported by Wireshark.
You can find the project here: Microsoft ETL2PCAPNG on GitHub
Precompiled releases are available from: ETL2PCAPNG Releases
Download an appropriate release from the official Microsoft repository and extract the executable to a convenient location.
For our example, let’s assume you’ve placed etl2pcapng.exe in the C:\Captures directory.
Open Command Prompt and enter:
cd C:\CapturesNow run:
etl2pcapng.exe nettrace.etl nettrace.pcapngThe utility examines the ETL file, extracts the supported packet capture information, and writes the resulting packets into a PCAPNG file.
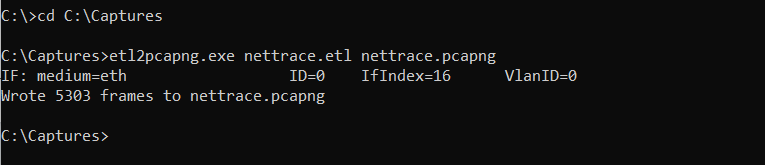
If successful, you should now have:
C:\Captures\nettrace.pcapng
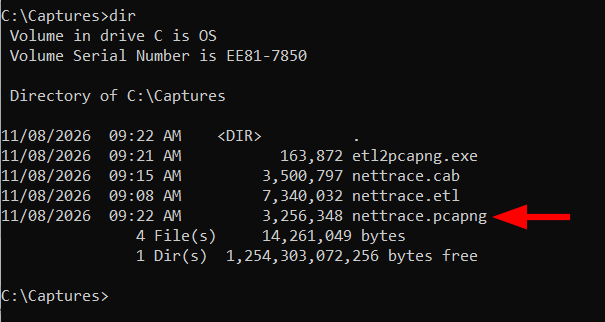
That’s the file we’ll open in Wireshark.
What Happens to the Windows Trace Events?
This distinction is worth understanding.
The PCAPNG conversion provides the packet information that can be represented in that format. It is not necessarily a complete representation of every Windows diagnostic event contained in the original ETL file.
For that reason, I recommend keeping the original ETL file until your troubleshooting investigation is complete.
If the problem involves operating-system networking behavior rather than just the packets themselves, the additional trace events may provide useful evidence.
Microsoft’s ETL2PCAPNG documentation also explains that packet-associated process IDs are not always reliable indicators of the application responsible for the traffic. Don’t assume a recorded PID automatically identifies the originating process.
Step 8: Open the Capture in Wireshark
Now we’re back in familiar territory.
Launch Wireshark and select:
File → Open
Navigate to:
C:\Captures\nettrace.pcapng
Open the file.
If the capture and conversion succeeded, you should see the captured packets in Wireshark’s packet list.
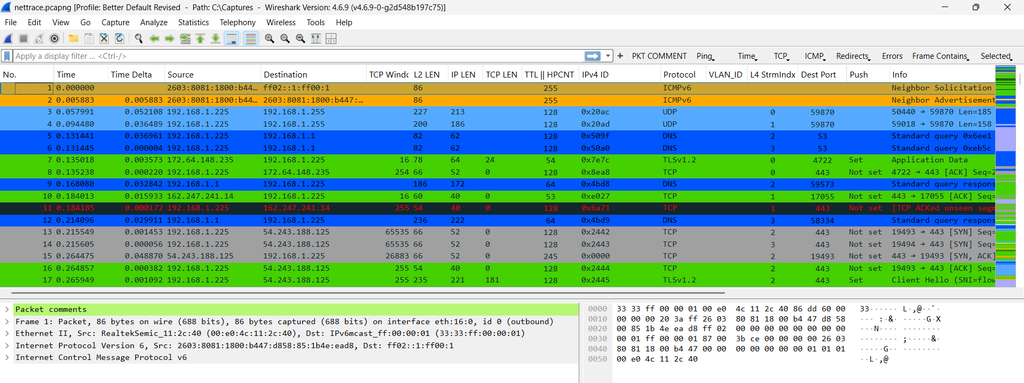
Let’s try a few display filters.
| What to Examine | Wireshark Display Filter |
|---|---|
| ICMP Echo traffic | icmp |
| DNS packets | dns |
| TCP traffic | tcp |
| UDP traffic | udp |
| QUIC traffic | quic |
| IPv6 traffic | ipv6 |
| TCP connection establishment | tcp.flags.syn == 1 |
| Traffic involving 1.1.1.1 | ip.addr == 1.1.1.1 |
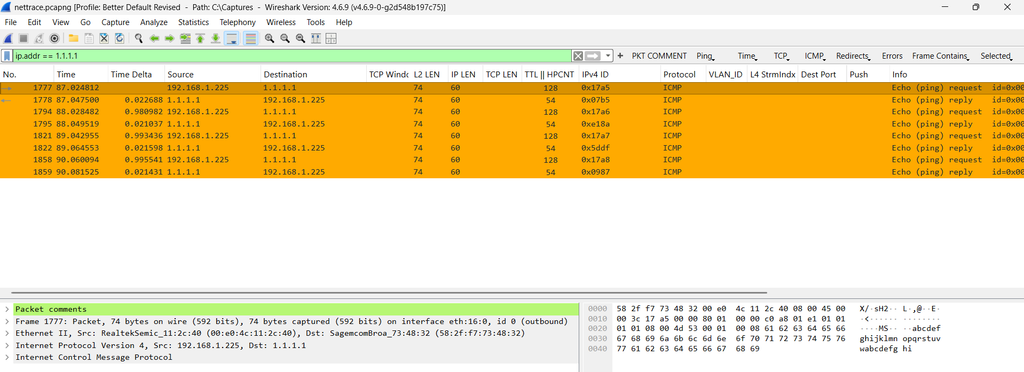
You can also use Wireshark’s Statistics → Conversations and Statistics → Protocol Hierarchy features to examine what was captured.
One thing to watch for is that Windows packet capture mechanisms may observe traffic at different points within the networking stack.
Depending on the capture configuration, this can produce multiple observations of a packet or reveal differences from a conventional capture taken on an Ethernet interface.
Don’t automatically interpret every duplicate-looking packet as a retransmission occurring on the network.
And remember that the converted capture can contain only the packet information collected by the original trace.
Step 9: Filter the Netsh Capture
There are situations where capturing everything is unnecessary.
For example, suppose you want to examine traffic involving a particular IPv4 destination.
Netsh supports capture filters that can reduce the amount of traffic collected.
To examine the available options, enter:
netsh trace show capturefilterhelpFor example, you can use an IPv4 address filter:
netsh trace start capture=yes report=no IPv4.Address=1.1.1.1 tracefile="C:\Captures\filtered.etl"This requests packet capture involving the specified IPv4 address.
After generating the relevant traffic, stop the trace:
netsh trace stopYou can then convert the resulting ETL file using the same ETL2PCAPNG procedure.
A useful distinction here is that Netsh capture filters are not identical to Wireshark display filters or libpcap capture filters.
You cannot simply copy a Wireshark expression into a Netsh command and expect it to work.
Use netsh trace show capturefilterhelp to examine the filter types and syntax available on your Windows system.
Also remember that filtering during capture permanently excludes traffic that doesn’t match the filter. If you aren’t sure which protocols are involved in the problem, a broader capture may be more useful initially.
Step 10: What About Windows Packet Monitor?
Since I originally wrote this article, Microsoft has introduced another built-in packet capture utility called Packet Monitor, commonly referred to as pktmon. I posted on this tool here: https://www.cellstream.com/2020/05/22/windows-pktmon/
Packet Monitor deserves attention because it can examine packets at multiple locations within the Windows networking stack.
This is particularly useful when investigating packet drops, virtual switches, network filtering, and other situations where traffic may behave differently as it moves through the operating system.
For example, from an elevated Command Prompt, you can start a basic packet capture using:
pktmon start --captureGenerate the network traffic you want to examine, then enter:
pktmon stopPacket Monitor normally generates an ETL log, and it includes a built-in conversion utility:
pktmon etl2pcap PktMon.etl --out PktMon.pcapngThe resulting PCAPNG file can be opened in Wireshark.
This is a convenient feature because a separate conversion application is not required for the basic Packet Monitor workflow.
Important: The built-in pktmon etl2pcap command is documented for Packet Monitor logs. For the Netsh-generated ETL files in our earlier procedure, use Microsoft’s ETL2PCAPNG utility rather than assuming the two conversion methods are interchangeable.
Packet Monitor also offers information about packet drops and processing within the networking stack that isn’t necessarily preserved in ordinary PCAPNG output.
You can learn more in Microsoft’s Packet Monitor Documentation.
Netsh, Packet Monitor, or Wireshark?
Which approach should you use?
Here’s how I would compare them.
| Capability | Netsh Trace | Packet Monitor | Wireshark |
|---|---|---|---|
| Included with Windows | Yes | Yes, on supported versions | No |
| Command-line capture | Yes | Yes | Through companion tools |
| Requires additional capture software | No | No | Typically Npcap on Windows |
| Native packet output | ETL | ETL | PCAPNG or PCAP |
| PCAPNG conversion | ETL2PCAPNG | Built-in or ETL2PCAPNG | Not required |
| Windows diagnostic events | Yes | Yes | Primarily packet analysis |
| Packet drop investigation | Limited | Stronger built-in support | Depends on capture source |
| Interactive packet analysis | No | Limited | Yes |
If I have Wireshark and Npcap available, I generally prefer using them for interactive packet capture and analysis.
If I need to collect a capture from a Windows computer where Wireshark isn’t installed, Netsh is an excellent option.
And if I’m specifically investigating packet processing or drops inside the Windows networking stack, Packet Monitor may provide additional evidence.
These tools complement one another rather than compete directly.
A Practical Troubleshooting Example
Suppose you’re supporting a Windows 11 computer where users report intermittent problems reaching a web application.
You don’t have Wireshark installed on that computer, but you want to capture the traffic while reproducing the failure.
Start a Netsh trace:
netsh trace start capture=yes report=no tracefile="C:\Captures\webproblem.etl" maxsize=256 filemode=circularNow reproduce the issue. Try accessing the web application and record the approximate time when the failure occurs.
Stop the trace:
netsh trace stopConvert the ETL file:
etl2pcapng.exe C:\Captures\webproblem.etl C:\Captures\webproblem.pcapngOpen the resulting PCAPNG file in Wireshark.
What should you investigate?
Begin with DNS. Did the computer successfully resolve the application’s hostname?
Next, look at TCP or QUIC, depending on the application and transport protocol being used.
If TCP is involved, did the three-way handshake complete? Are there retransmissions or resets? Does the connection terminate unexpectedly?
If the application uses QUIC, examine the UDP communication and available QUIC handshake information.
The fact that the packets were collected using Netsh doesn’t change the fundamental packet analysis process.
We still need to establish what the protocol exchange should look like and compare that expectation with the captured traffic.
Some Important Capture Limitations
Before concluding, there are several limitations worth understanding.
Capturing Locally Is Not the Same as Capturing on the Wire
Packet capture performed inside Windows provides visibility into traffic observed by the operating system’s capture components.
That may not be identical to packets observed by an external network tap or switch mirror port.
For example, checksum offloading and segmentation offloading can affect how packets appear in a host-side capture.
Packets may be captured before or after particular processing operations, depending on the capture mechanism.
This becomes important when investigating Ethernet framing, TCP segmentation, checksum errors, or packet timing.
Capturing Wi-Fi Does Not Automatically Mean Capturing 802.11 Frames
If you capture packets on a computer using Wi-Fi, that doesn’t necessarily mean you’re collecting raw IEEE 802.11 management, control, and data frames.
Windows may present ordinary network traffic through a different encapsulation.
For raw wireless troubleshooting, you need an appropriate adapter, driver, and capture configuration.
I’ve explored that subject separately in: Capturing Wi-Fi/WLAN Packets on Windows for Free
Packet Captures May Contain Sensitive Information
Even when application payloads are encrypted, packet captures may reveal IP addresses, hostnames, DNS queries, connection metadata, and other potentially sensitive information.
Windows diagnostic traces may also contain information about the operating system and networking configuration.
Treat capture files as diagnostic evidence and handle them according to the security and privacy requirements of the environment.
Don’t Leave Packet Captures Running Unnecessarily
Long-running captures can consume disk space, generate significant diagnostic data, and increase resource usage.
Use appropriate size limits, filters, and capture durations. When investigating a particular problem, collect enough information to reproduce it, then stop the capture.
Final Thoughts
When I first wrote about capturing packets with Netsh in 2017, I liked the fact that Windows already included a packet capture capability.
I still do.
For technicians who need to collect network traffic from systems where Wireshark isn’t installed, Netsh provides a useful alternative. The ability to convert the resulting ETL file into PCAPNG using ETL2PCAPNG makes the workflow considerably more practical than it was when I originally published this article.
Microsoft’s Packet Monitor adds another option, particularly for investigating traffic as it moves through the Windows networking stack.
But collecting packets is only the beginning.
The real value comes from understanding where the packets were captured, what information was preserved, and what the protocol exchanges reveal about the problem.
That’s why I continue to emphasize the difference between packet capture and packet analysis.
You can collect thousands of packets without learning anything useful if you don’t know what you’re looking for. On the other hand, a short, carefully planned capture can tell you a great deal about how a network or application is behaving. And sometimes, the tools you need are already installed in Windows.
References and Additional Resources
Microsoft and Wireshark resources
- Microsoft Netsh Trace Documentation
- Microsoft ETL2PCAPNG Repository
- Microsoft Packet Monitor Documentation
- Packet Monitor PCAPNG Conversion
- Wireshark Official Website
Related CellStream articles
- The Netsh Shell/Scripting Tool in Windows
- Capturing Wi-Fi/WLAN Packets on Windows for Free
- CellStream Wireshark Profiles Repository
- CellStream Windows Networking Toolkit
- IPv6 Windows Command-Line Examples
If you would like to help support the continued development of independent networking, broadband, Wi-Fi, VoIP, and packet analysis content, please consider joining our Patreon community where you will gain access to exclusive technical resources, downloadable labs and PCAPs, bonus course content, troubleshooting guides, and additional member-only material. Comments and technical discussion are always welcomed at our Patreon community or on our Discord server. You can also support our work by simply buying us a coffee — every contribution helps us continue creating practical, real-world network science education for professionals and enthusiasts alike.