Monitoring, analyzing, managing, and diagraming a network can often be a huge problem for Network and System Administrators. They are often vendor specific or cost large sums of money to license. We also have the challenge of so many different network infrastructures, like Wi-Fi and wired.
If you are looking for a list of tools we have in our “Go Bag”, look here.
If you are looking for a tool that may save you money, or is relatively vendor agnostic, you may find something useful in the following list below. All these tools can be essential to troubleshooting network issues, as well as learning how the network works.
We have expanded the list to include some other essential tools as well.
Not all these tools are perfect, nor all encompassing. You may need to use some in combination depending on your needs.
Below, I have compiled a list of tools below that may be possible solutions. They are in no particular order per se. I did put Wi-Fi stuff in the middle and stand alone, application specific (sniffers, etc.) towards the end of the list.
If you are looking for a Networking Tools list – check out our article here.
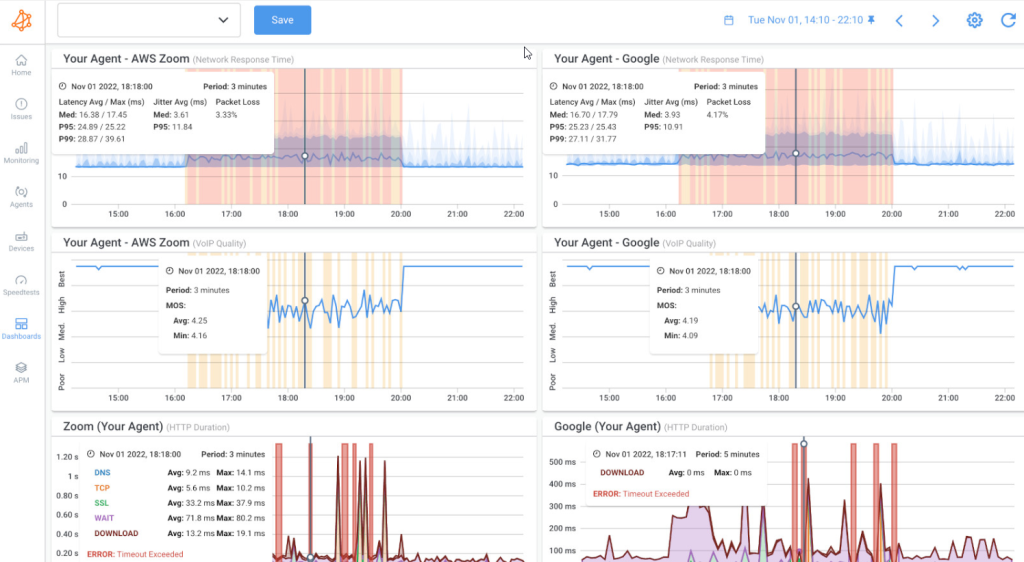
Datadog Network Performance Monitoring
Web Page: Datadog Network Performance Monitoring
Start a 15-day free trial.
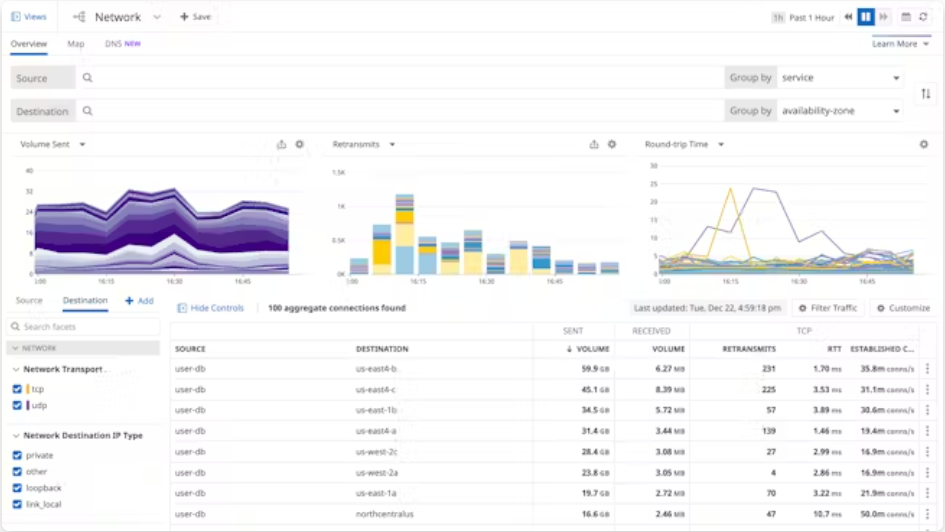
A cloud-based network monitoring and management service that includes auto-discovery, topology mapping, performance alerts, and troubleshooting tools.
LibreNMS
Web Page: https://www.librenms.org/
Cost: Free

LibreNMS, is a fully featured network monitoring system that provides a wealth of features and device support.LibreNMS is a fork of Observium.
IPTraf
Web Page: http://iptraf.seul.org/
Cost: Free
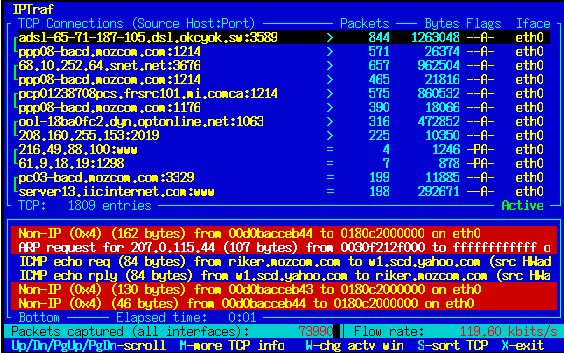
Let’s start a little old school with IPTraf – IPTraf is a console-based network statistics utility for Linux. It gathers a variety of figures such as TCP connection packet and byte counts, interface statistics and activity indicators, TCP/UDP traffic breakdowns, and LAN station packet and byte counts.
ManageEngine
Web Page: ManageEngine OpManager Plus (FREE TRIAL)
Cost: Start a 30-day free trial.
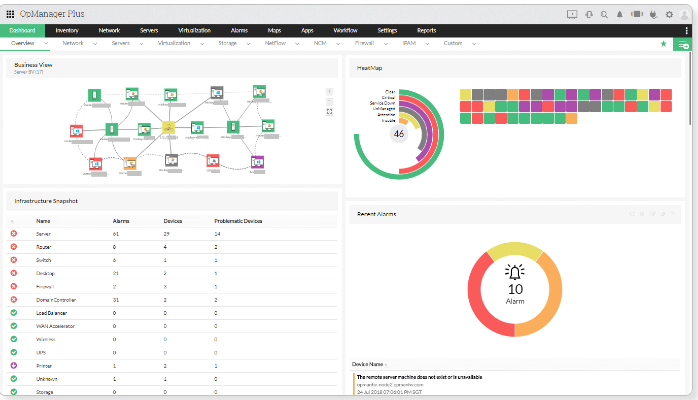
This bundle of seven ManageEngine tools provides full network monitoring and analysis capabilities. Installs on Windows Server and Linux.
Prometheus
Web Page: https://prometheus.io
Cost: Free

Prometheus is an open-source systems monitoring and alerting toolkit originally built at SoundCloud. Since its inception in 2012, many companies and organizations have adopted Prometheus, and the project has a very active developer and user community. It is now a standalone open source project and maintained independently of any company. To emphasize this, and to clarify the project’s governance structure, Prometheus joined the Cloud Native Computing Foundation in 2016 as the second hosted project, after Kubernetes.
Prometheus collects and stores its metrics as time series data, i.e. metrics information is stored with the timestamp at which it was recorded, alongside optional key-value pairs called labels.
Grafana
Web Page: https://grafana.com
Cost: Free
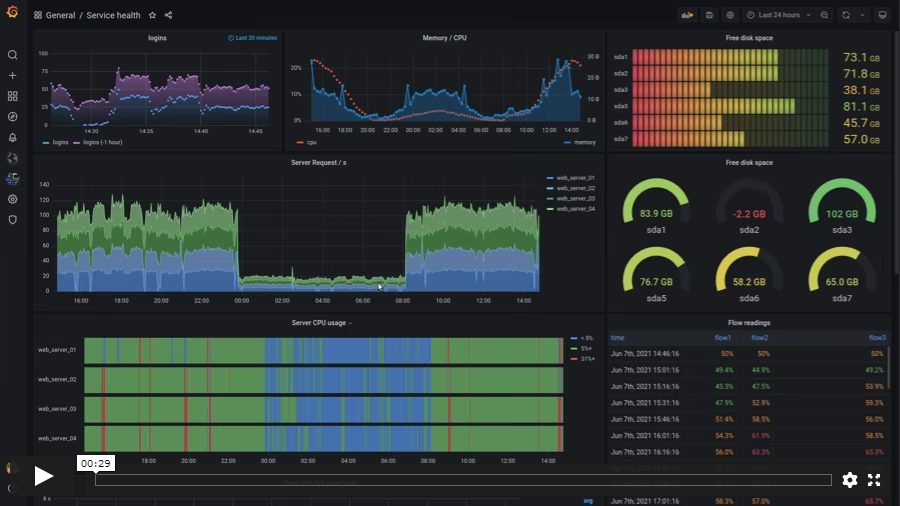
Query, visualize, alert on, and understand your data no matter where it’s stored. With Grafana you can create, explore and share all of your data through beautiful, flexible dashboards.
Checkmk
Web Page: https://checkmk.com
Cost: Free and Paid versions
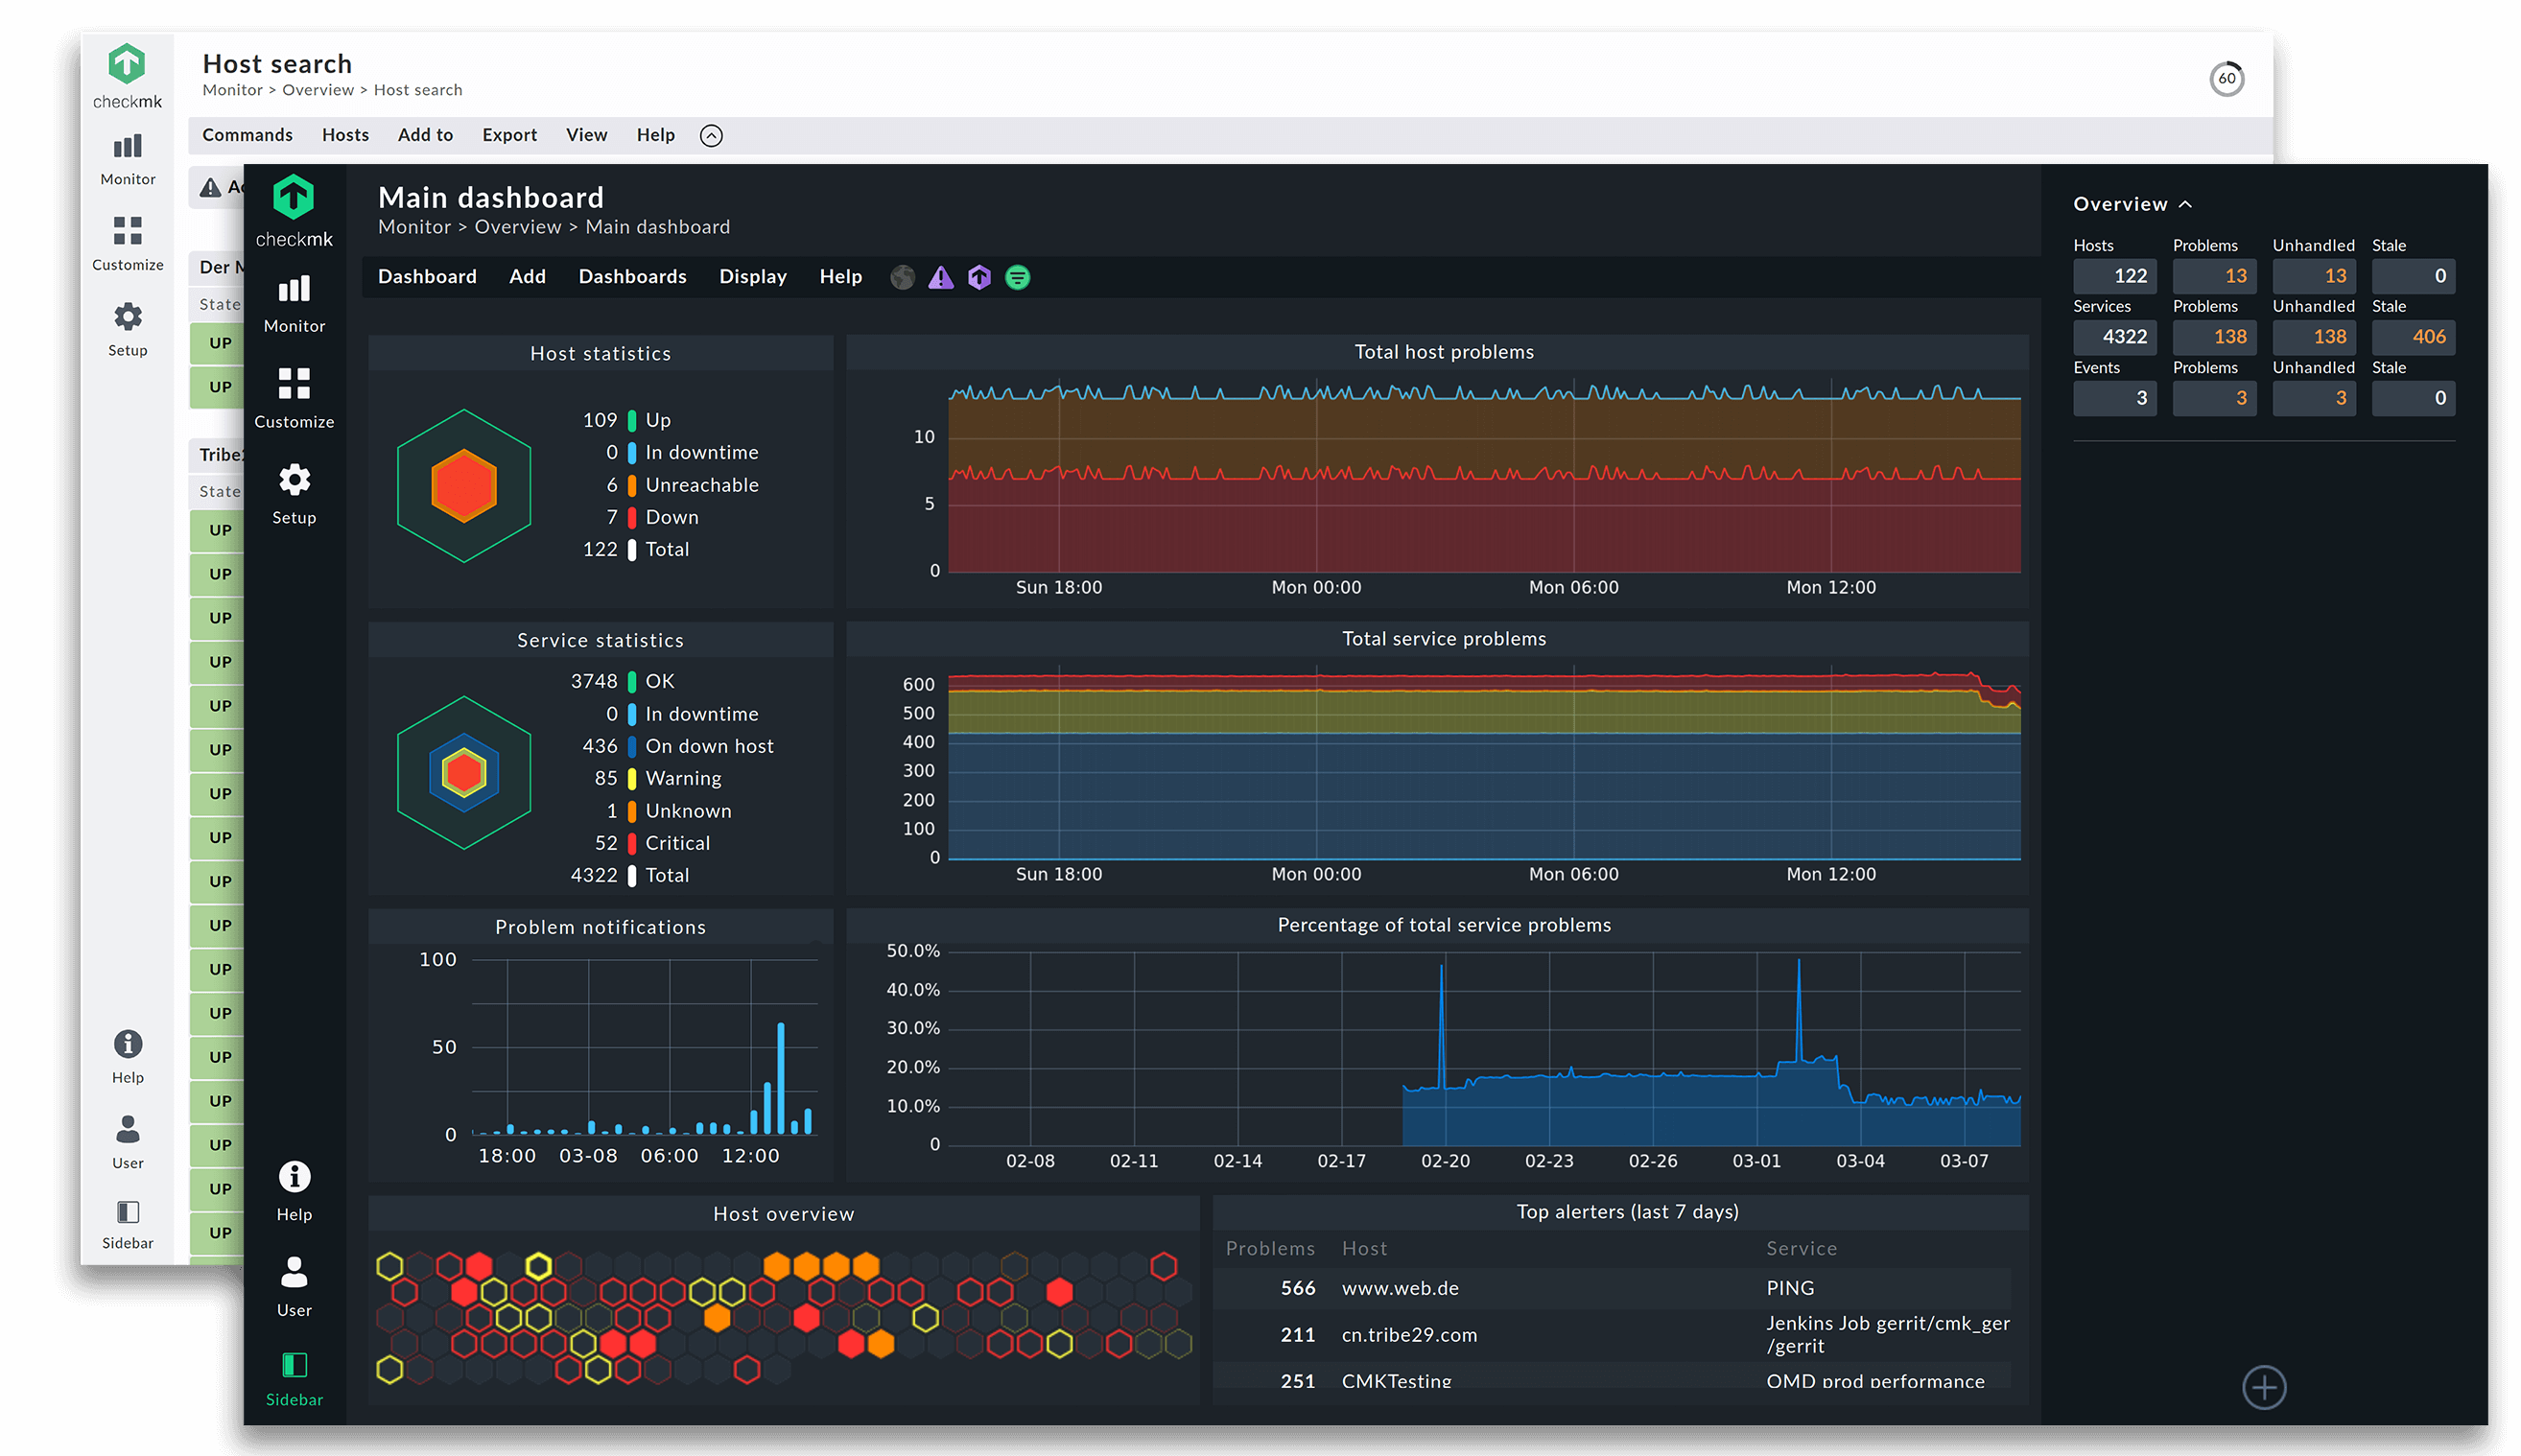
Everything monitored Quickly gain a complete view of your IT infrastructure, no matter how complex. Checkmk provides powerful monitoring of networks, servers, clouds, containers and applications. Fast. Effective.
Sensu
Website: https://sensu.io/products/core
Cost: Free to start – then monthly charges
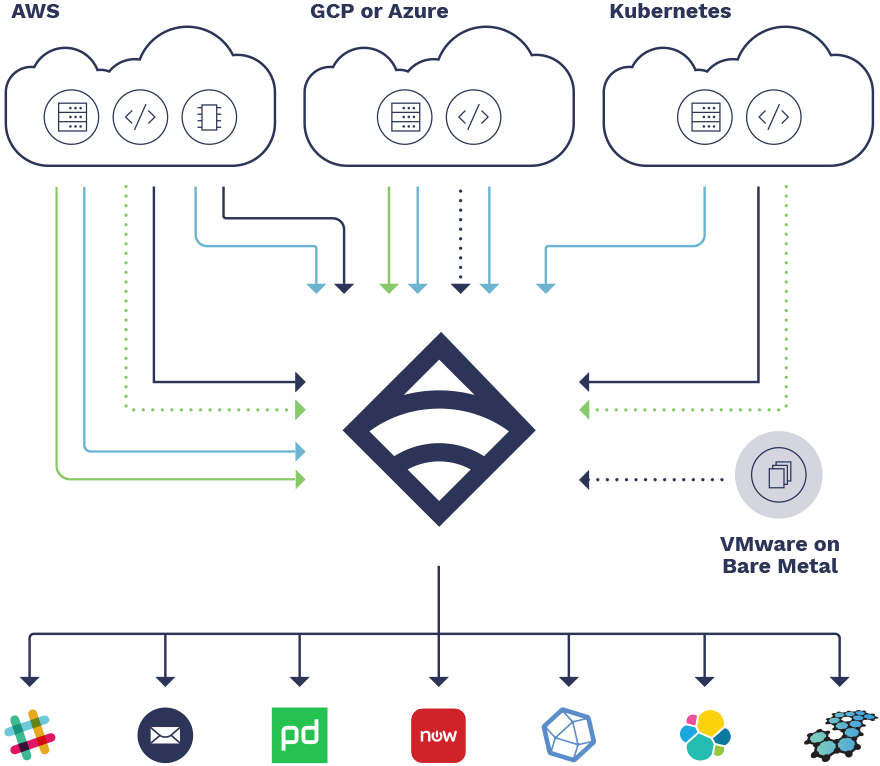
Sensu Core uses service checks and event processing as the main building blocks of its monitoring solution. The services checks monitor resources usage such as memory, CPU utilization and bandwidth, and confirm whether a service such as a Web or database server is running. To accomplish this, Sensu Core utilizes agents, which could be the Sensu client, or SNMP and other protocols. The services checks utilize the same specifications as Nagios, allowing the use of Nagios plugins. Event processing is performed by the Sensu Server and provides a way to take various actions in response to alerts created by the service checks.
Observium
Web Page: http://www.observium.org/
Cost: Free to get started

Observium is a low-maintenance auto-discovering network monitoring platform supporting a wide range of device types, platforms and operating systems including Cisco, Windows, Linux, HP, Juniper, Dell, FreeBSD, Brocade, Netscaler, NetApp and many more. Observium focuses on providing a beautiful and powerful yet simple and intuitive interface to the health and status of your network.
Professionally developed and maintained by a team of experienced network engineers and systems administrators, Observium is a platform designed and built by its users.
Site24x7 Network Monitoring
Web Page: Site24x7 Network Monitoring
Cost: Free Trial
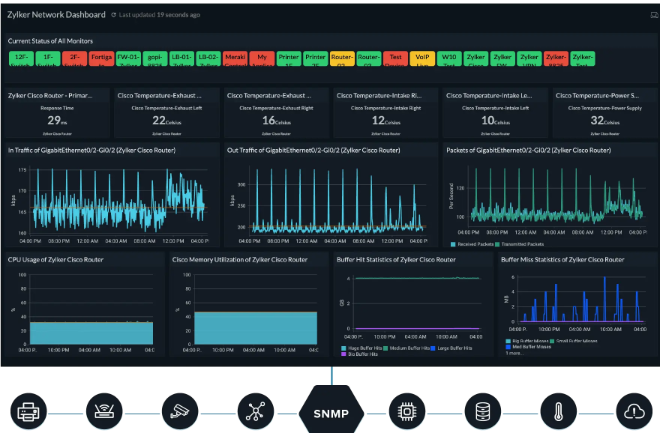
A cloud-based service that monitors network devices, tracks traffic patterns, provides capacity planning support, and offers troubleshooting tools.
TeemIP
Web Page: https://www.combodo.com/teemip-194
Cost: Free
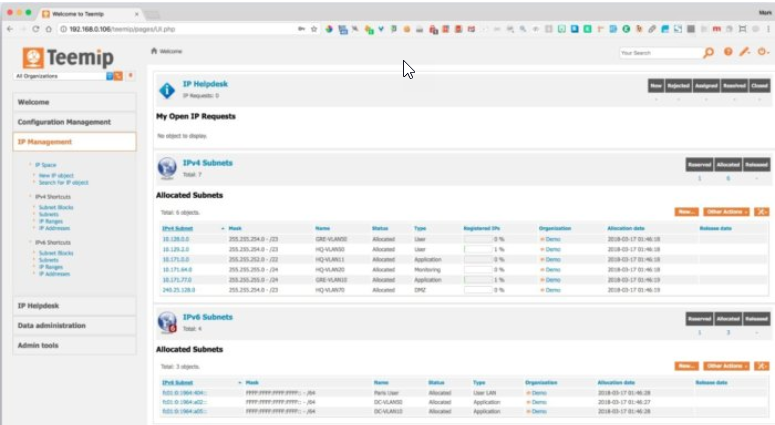
TeemIP is a Change Management Database system that combines IP address management with a trouble-ticketing system so that IP addresses and network devices can be managed in the context of locations, organizations, users and roles, and user trouble and change requests can be tracked.
SpiceWorks Network Monitor
Web Page: https://www.spiceworks.com/
Cost: Free to get started
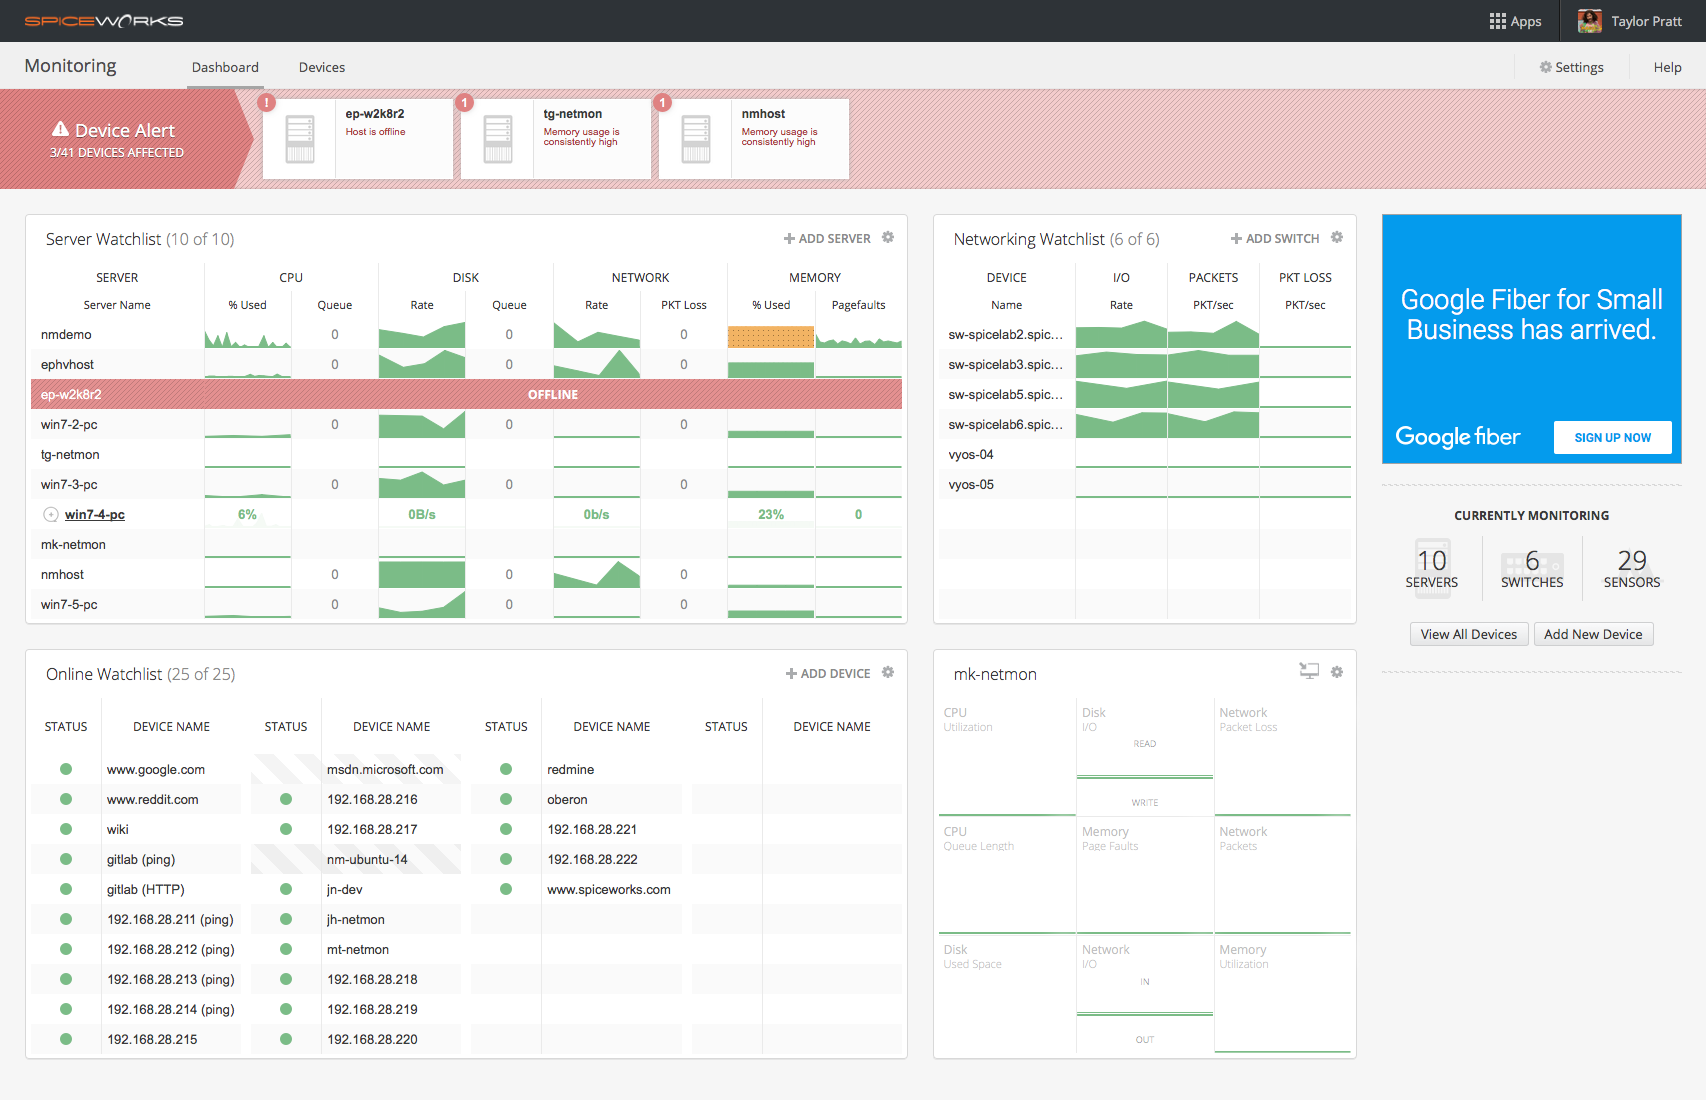
SpiceWorks actually has a suite of tools of which Network Monitor is one. Spiceworks Network Monitor is simple to install and easy to set up. Quickly add devices to the dashboard and see data lightning fast. Get real-time network insights and spot slow, sluggish, or overwhelmed systems and devices long before they crash or users start calling.
Node Red
Website: https://nodered.org/
Cost: Free to start
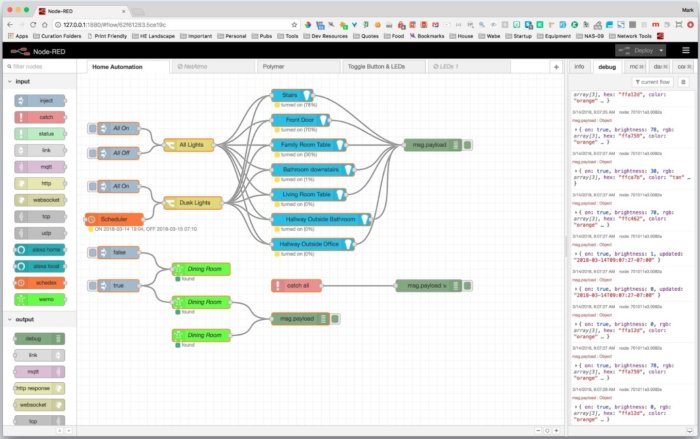
Internet of Things projects are what all the cool kids are into these days, and one of the faves in this world is Node-RED, a flow-based programming system developed by IBM. Based on the Node.js JavaScript, Node-RED runs on every operating system Node.js supports, which includes Windows, Linux, macOS, SunOS and AIX.
OpenNMS
Website: https://www.opennms.org/en
Cost: Free
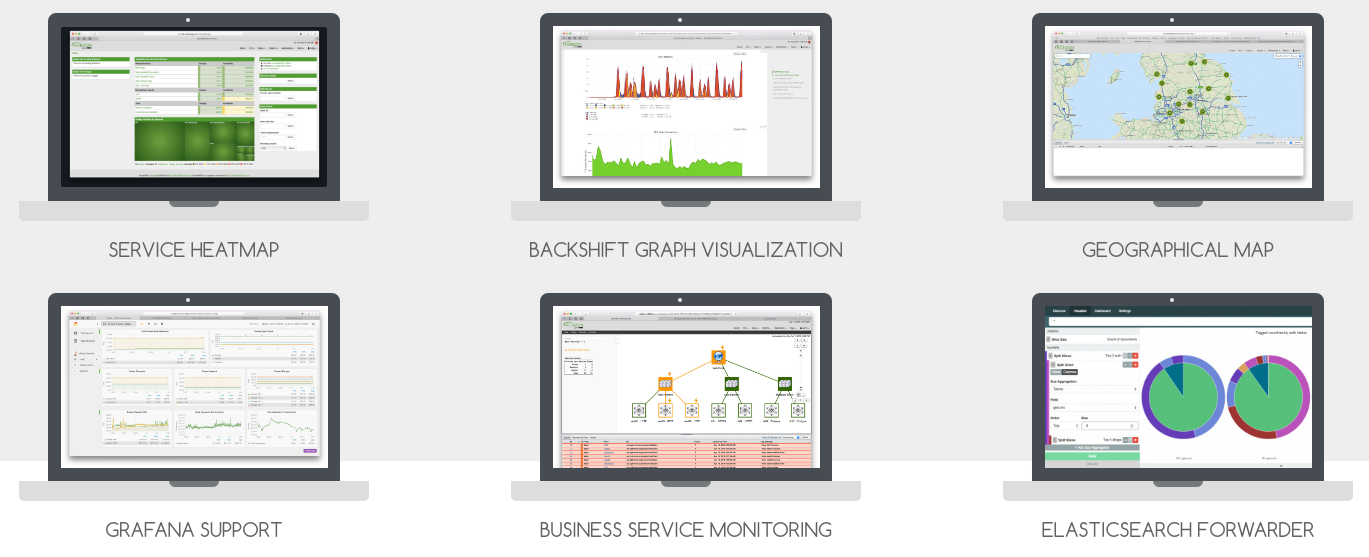
OpenNMS is a carrier-grade, highly integrated, open source platform designed for building network monitoring solutions. There are two distributions of OpenNMS: Meridian and Horizon. Using Meridian is advisable for enterprises and businesses looking for stability and long term support. Horizon is the place where innovation happens quickly and is ideal for monitoring new technologies and IT ecosystems. Both distributions are completely open source.
Auvik
Website: https://www.auvik.com/
Cost: Free Trial
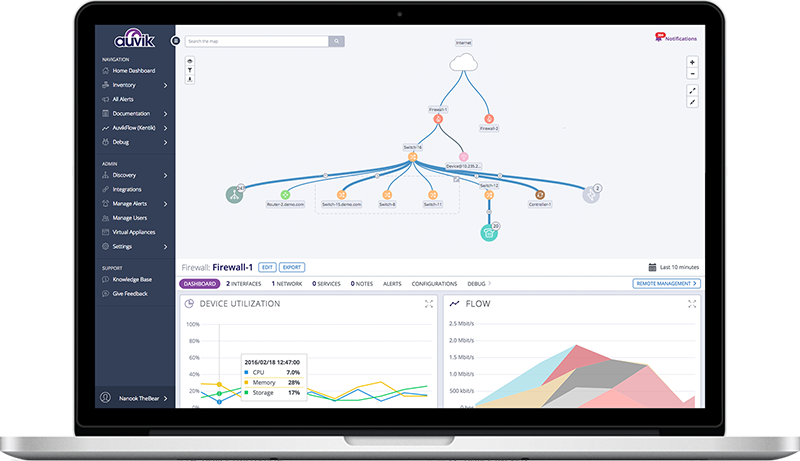
Auvik is a cloud-based managed service provider (MSP) that helps to manage and deliver profitable network services. It’s network infrastructure RMM (remote monitoring and management) provides insight into client networks and automates complicated, time-consuming tasks. Auvik manages multiple networks in one dashboard so users can switch easily between clients for a smooth workflow.
Auvik’s main feature is the dashboard that displays a neat, geographic map of the client network with information on how the user’s clients are connected and their location. All clients visually presented on the map provide detailed status information to help users prepare for initial assessments and quotes. Each topology is also managed in real-time.
With Auvik, there is no need to manually login to each device when searching for an IP address. The network evidence feature enables users to simply type in the device name to automatically see where it has been seen across the network, reducing troubleshooting time. All previous data and work history is stored on Auvik’s cloud, and provides users with detailed records useful for analysis, troubleshooting issues, and generating reports.
Cacti
Website: http://www.cacti.net/
Cost: Free
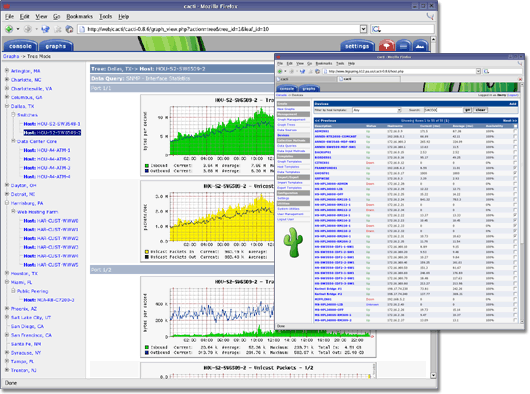
Cacti is an open-source, web-based network monitoring and graphing tool designed as a front-end application for the open-source, industry-standard data logging tool RRDtool. Cacti allows a user to poll services at predetermined intervals and graph the resulting data. It is generally used to graph time-series data of metrics such as CPU load and network bandwidth utilization. A common usage is to monitor network traffic by polling a network switch or router interface via Simple Network Management Protocol (SNMP).
Circonus
Website: https://www.circonus.com/
Cost: Free to Try
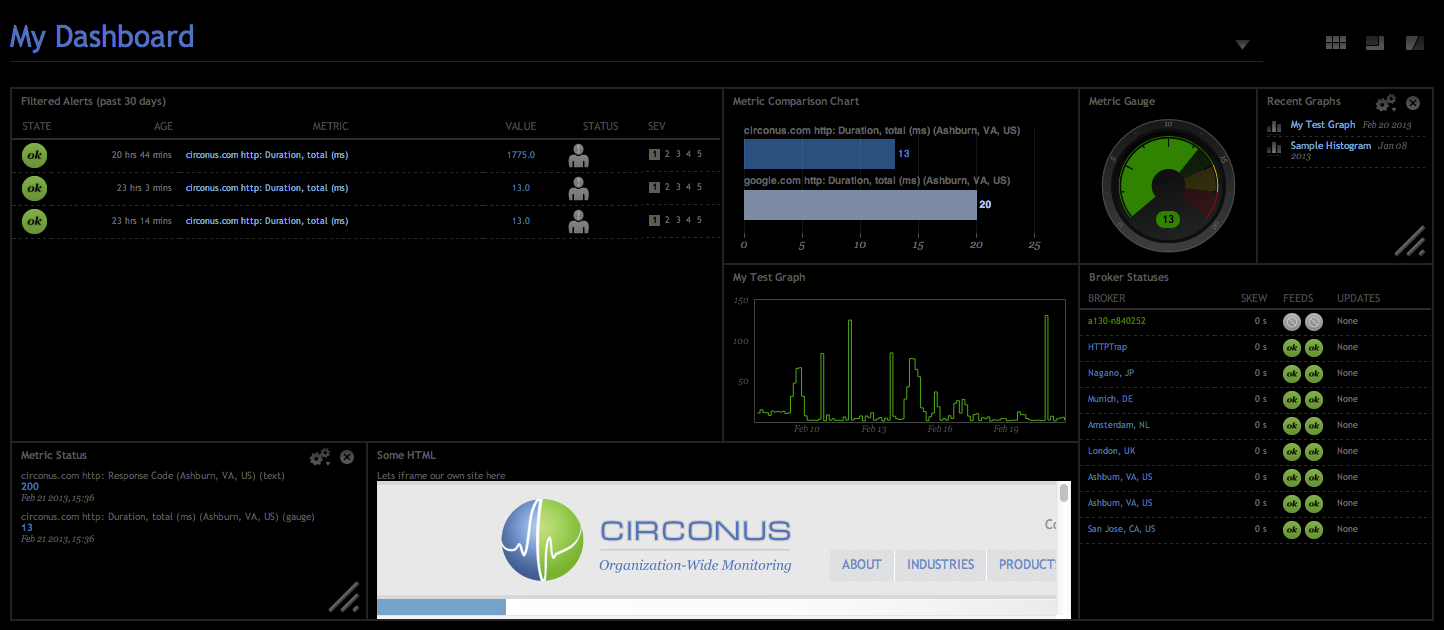
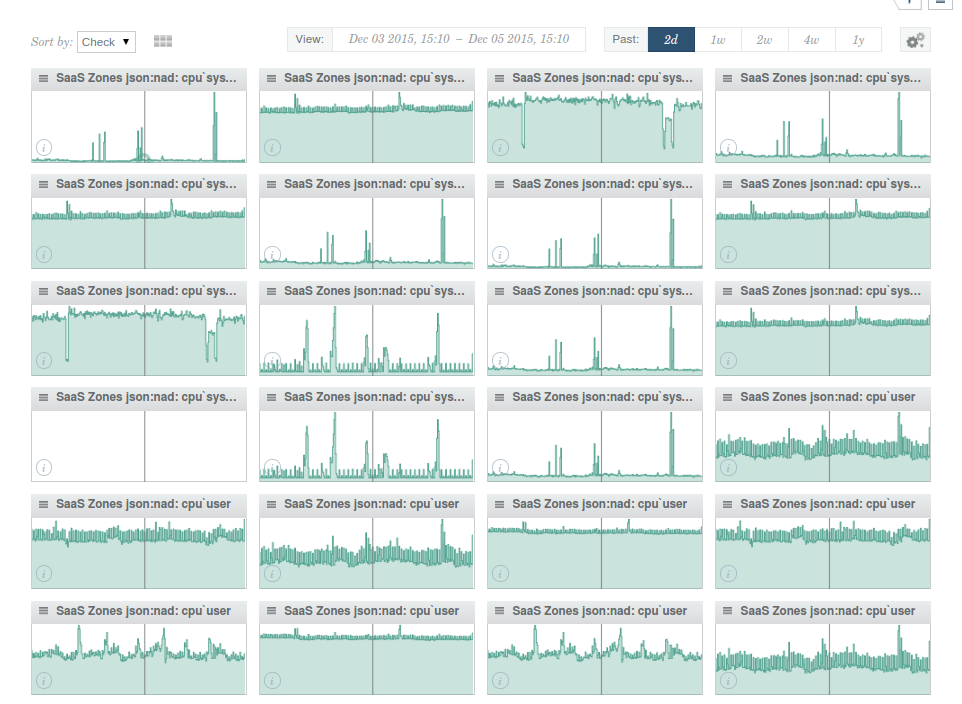
Circonus is a platform to enable engineers to understand the behavior of their systems. The monitoring and analytics platform provides the engineering team with the tools, support, & insight with fast, accurate results to deliver the best online experience for customers. More reliable than the systems it monitors, Circonus handles any tech at any scale, storing the complete distribution of data.
Intermapper
Website: https://www.helpsystems.com/products/network-monitoring-software
Cost: Free to Try
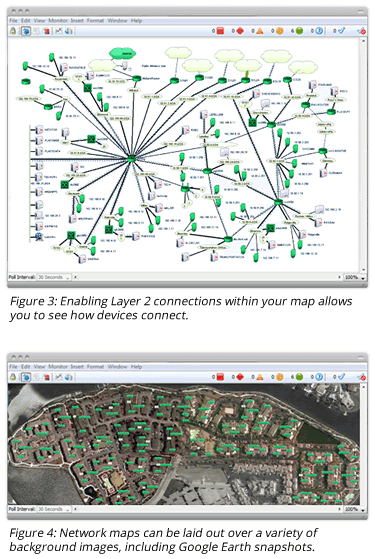
Intermapper is powerful, user-friendly network mapping and monitoring software for Windows, Linux, and Mac. The tool offers a free, fully functional 30-day trial, during which technical consultants can help you get started and create your maps. Pricing is by the number of devices you want to monitor (starting at $765 for 25 devices and 1 year of maintenance). Network administrators love the ability to create a live map of their network showing where devices are located and their status, indicated by color-coded icons and interactive elements. You can create custom alerts to notify you of network issues before customers or users are affected. The visual mapping makes troubleshooting much faster because you can identify the source of problems and dig into metrics to monitor. Intermapper supports SNMP and can monitor a wide variety of standard and non-standard network equipment through the online probes library. They also have add-on products for NetFlow monitoring and remote network monitoring.
Atom Editor
Website: https://atom.io/
Cost: Free
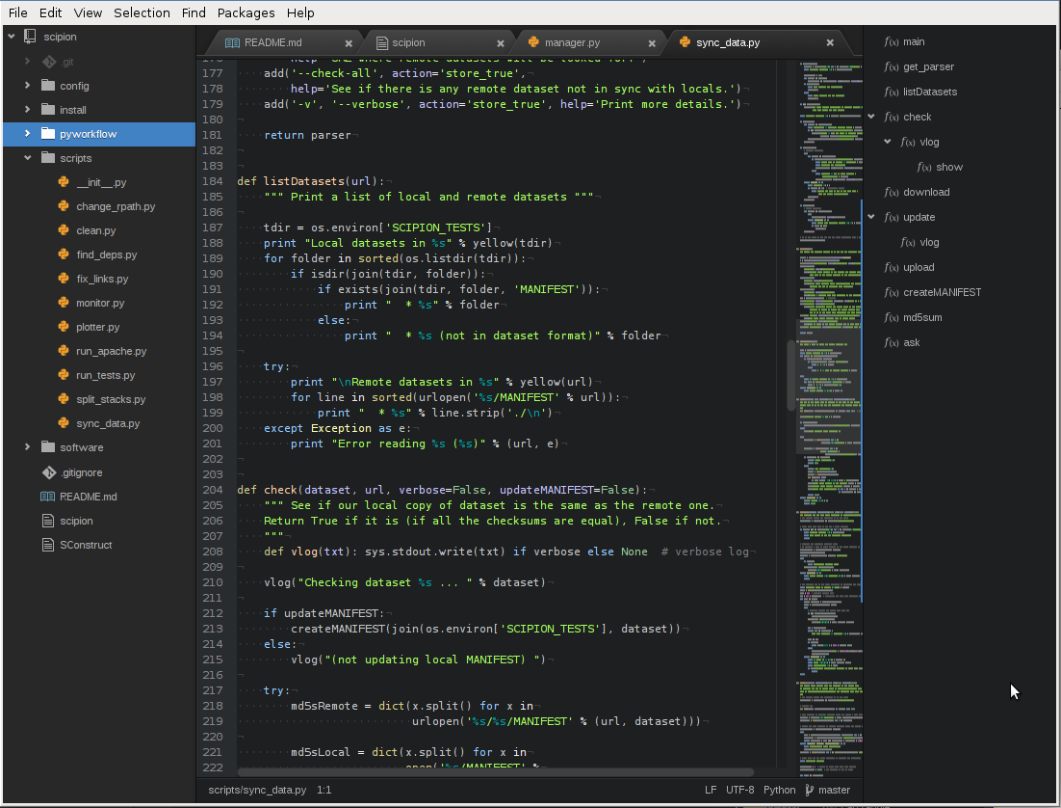
How often do you have to edit a configuration file or review a log or hack some code? If you’re in the IT business these tasks come up all the time, so what tools do you use? If the answer is a list of applications rather than a single tool, check out Atom, a free, open source editor that’s incredibly versatile, extensible, small and runs on Windows, macOS and Linux. Atom is also eminently hackable as it’s built on Electron, a framework for building cross-platform apps that’s based on HTML, JavaScript, CSS and Node.js.
ProcessMaker
Website: https://www.joget.org/
Cost: Free
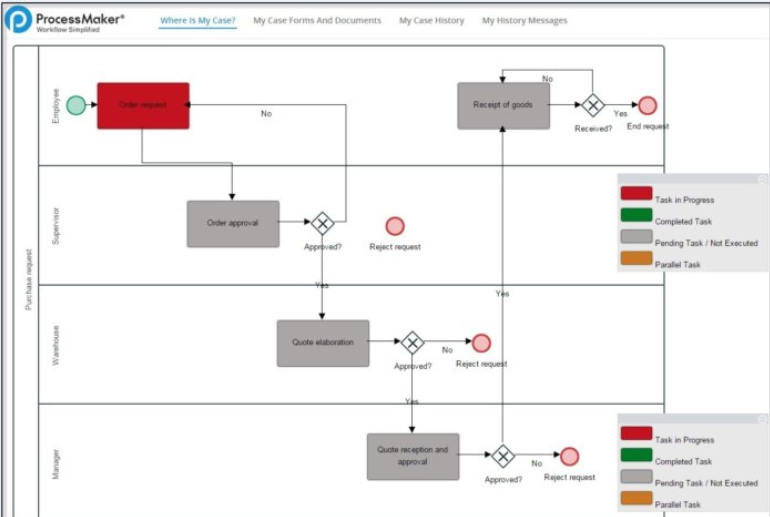
ProcessMaker offers an eponymous free, open source Web-based workflow development and deployment system that runs on all major platforms including Windows, macOS, Linux, Google Cloud, OpenShift and Cloud Foundry, as well as several Java EE application servers. ProcessMaker also has premium editions with extra features and support, but for internal purposes and testing, the community edition is incredibly useful and powerful.
Monitis
Website: http://www.monitis.com
Cost: Free to get started
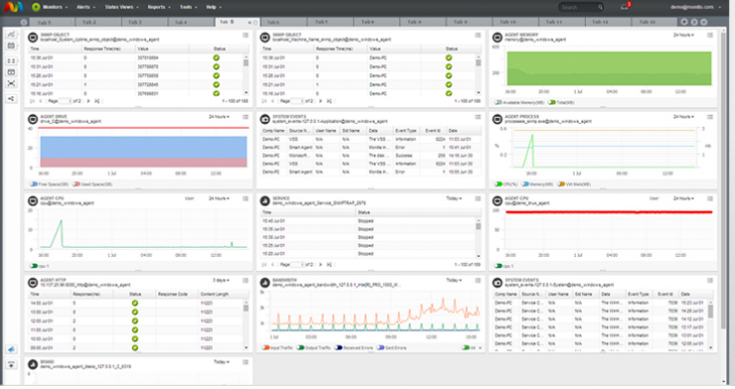
Monitis is an all-in-one web application monitoring solution from the cloud that sets you free from the limits of software-based monitoring tools and gives you a total visibility of your entire application universe. It’s fast, intuitive and easy to use, giving you the deep insights, quickly. Get up and running in just 3 minutes and monitor literally everything via extendable API and plugins. Services include Website Monitoring, Server Monitoring, Network Monitoring, Application Monitoring, Cloud Monitoring, with their own API for custom monitoring.
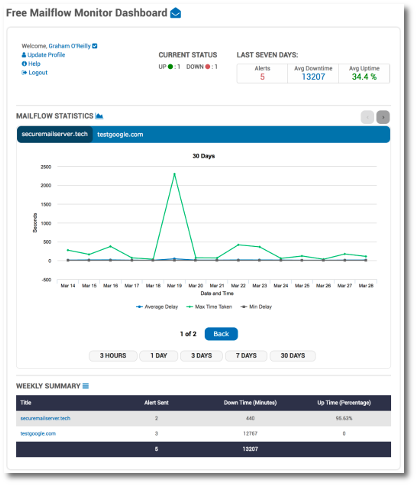
Mail Flow Monitor
Website: https://www.everycloud.com/fre
Cost: Free to try
Nagios
Website: https://www.nagios.org/
Cost: Free

Nagios is a powerful IT management system and IT monitoring software suite that enables
organizations to identify and resolve IT infrastructure problems before they affect critical business processes.
Obkio
Web Site: https://obkio.com/?utm_source=comparitech&utm_medium=network+troubleshooting+tools
Cost: Free Trial
This cloud-based monitoring package will test a connection between two given points on your network or on the internet.
NetXMS
Website: https://www.netxms.org/
Cost: Free
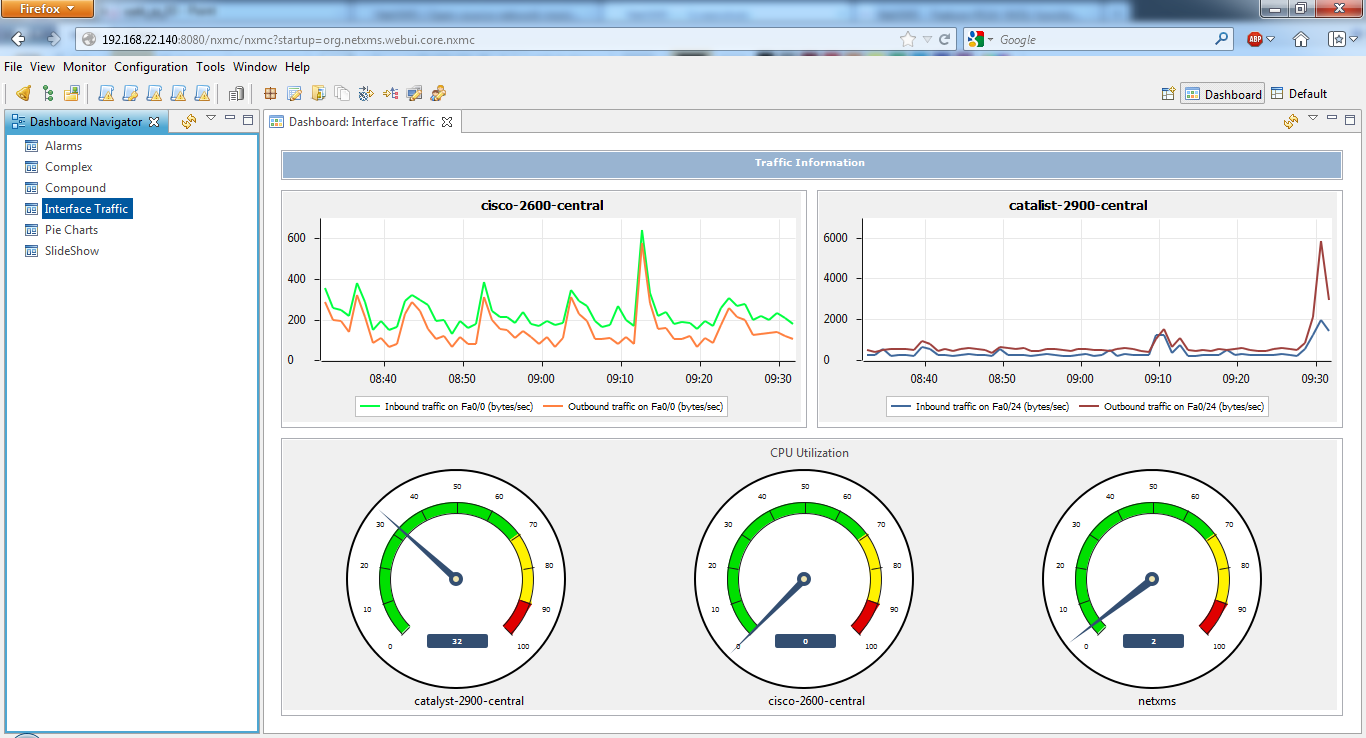
NetXMS is an enterprise grade multi-platform open source network management and monitoring system. It provides comprehensive event management, performance monitoring, alerting, reporting and graphing for all layers of IT infrastructure — from network devices to business application layer.
The system has three-tier architecture: the information is collected by monitoring agents (either our own high-performance agents or SNMP agents) and delivered to monitoring server for processing and storing. Network administrator can access collected data using rich client application or web interface.
Having been designed with flexibility and scalability in mind, NetXMS features a wide range of supported platforms, operating systems and database engines, thus ensuring seamless integration with any infrastructure.
OpManager
Website:
Cost: $595, free to try
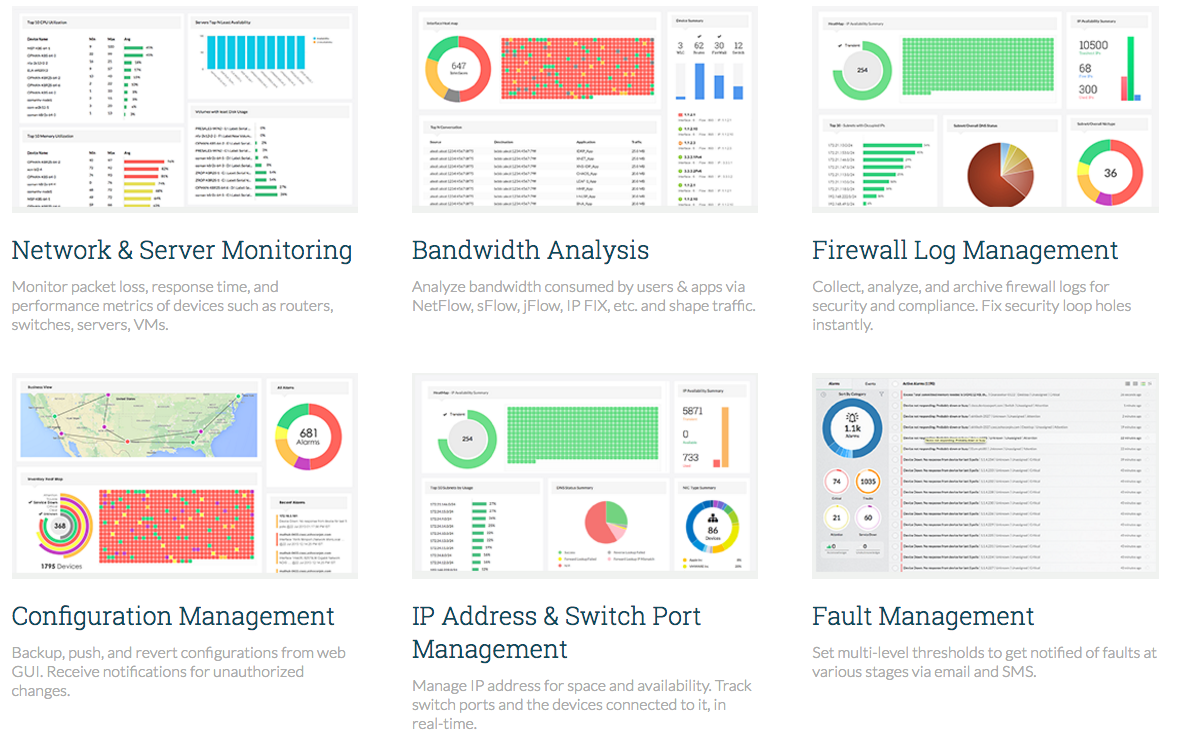
Integrated network management software for today’s networks! Managing network performance is always a great challenge. This doubles when multiple point-products are used to manage it. Introducing OpManager v12.2, world’s first truly integrated network management software for faster and smarter network management.
Op5 Monitor
Website: https://www.op5.com/
Cost: Free Trial
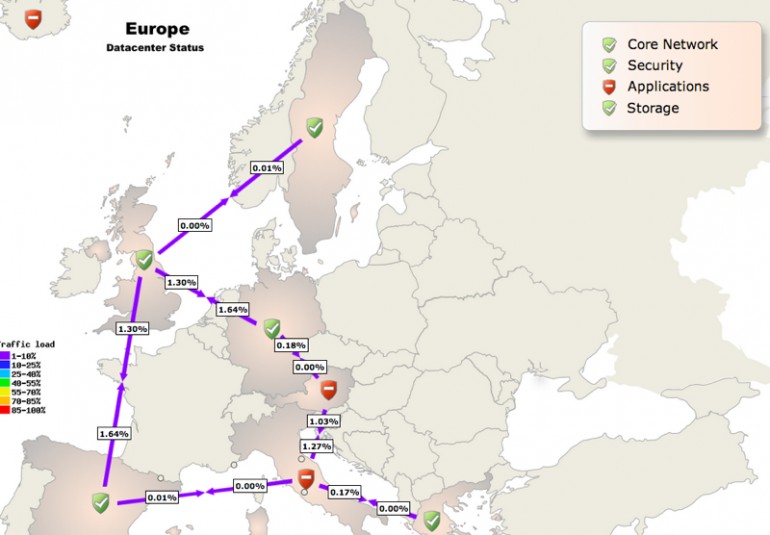
When you are in need of improved control, we have the solution – whether your services run in the cloud, on virtual infrastructure or in the basement. The IT department will always be held responsible for ensuring up-time. op5 Monitor provides a detailed, single unified overview of all your systems which makes it easy to stay in control. op5 Monitor was specifically designed to be a flexible and scalable solution, able to handle very large volumes of monitored devices and checks. The performance and capacity of op5 Monitor, together with an easy-to-use interface, provides you with a powerful solution today, and tomorrow.
SAYMON
Website: http://saymon.info/en-version/
Cost: Free Trial
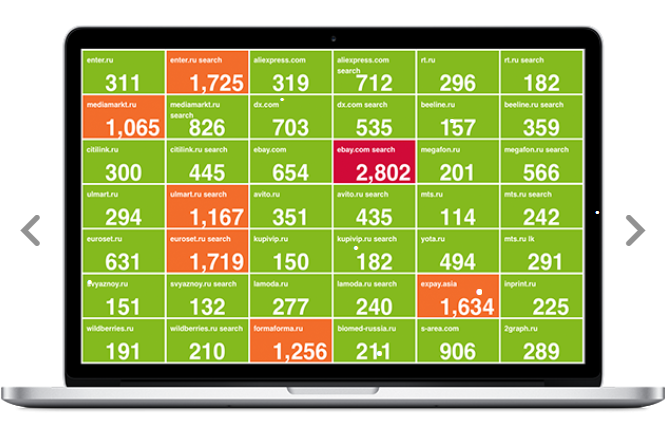
Light. Fast. Beautiful. Modern high-performance platform for solving the problems of description, visualization, monitoring and analysis of processes and their items. Expertise and experience in the areas of IT and telecom has created the platform based on the best ideas of traditional OSS / BSS / NGOSS (Frameworx) solutions and modern HTML / AJAX, SQL / noSQL and TimeSeries technologies. The platform works with heterogeneous systems (e.g., the Internet of Things) and has powerful business intelligence capabilities.
The Dude
Website: http://www.mikrotik.com/thedude
Cost: Free

We started using this years ago when we first met MikroTik. The Dude network monitor is a new application by MikroTik which can dramatically improve the way you manage your network environment. It will automatically scan all devices within specified subnets, draw and layout a map of your networks, monitor services of your devices and alert you in case some service has problems.
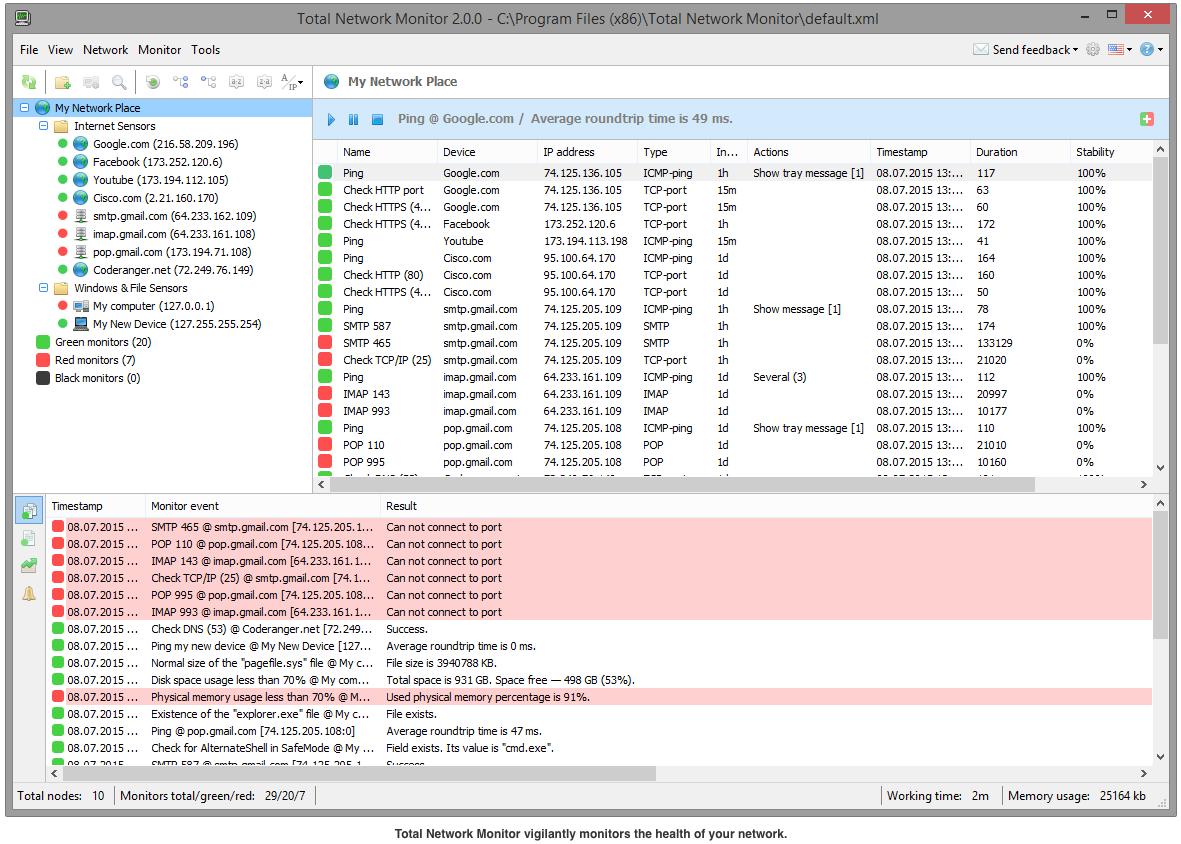
Total Network Monitor
Website: https://www.softinventive.com/total-network-monitor/
Cost: Free Trial
Pandora FMS
Website: https://pandorafms.com/
Cost: Free Trial
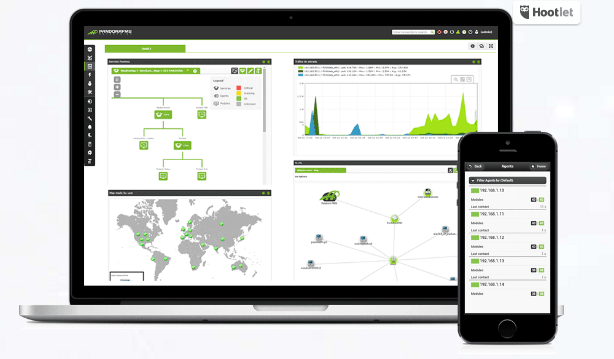
Stop spending precious time and resources on complex, silo’d monitoring systems that are poorly integrated. Pandora FMS is an elegant and modern system that solves real-world problems quickly. It’s an all-in-one package offering modern and flexible IT monitoring, replacing the need for multiple, difficult-to-integrate, and more costly monitoring systems.
Zabbix
Website: http://www.zabbix.com/
Cost: Free
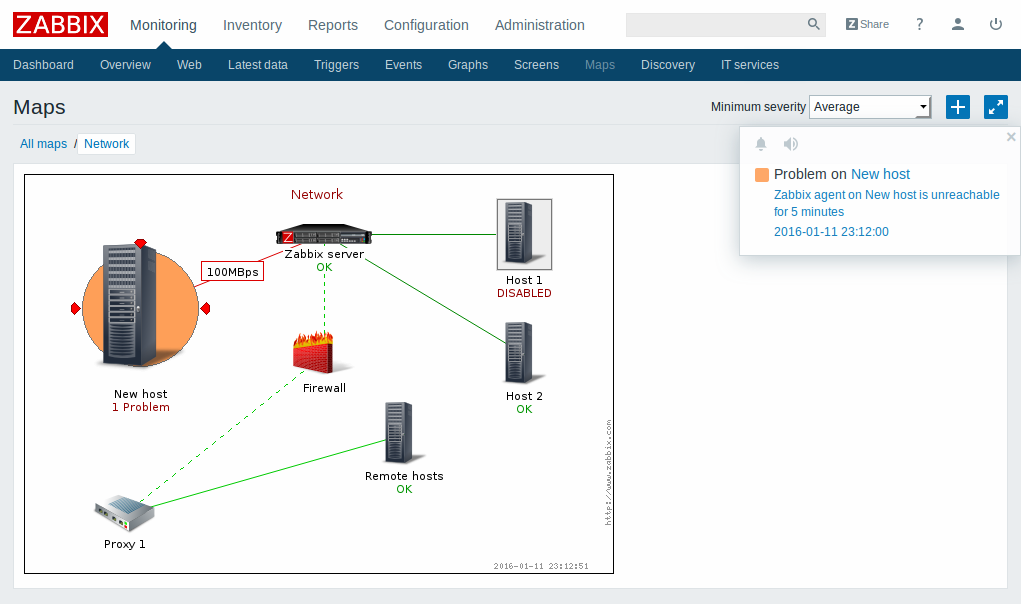
Zabbix is the ultimate enterprise-level software designed for real-time monitoring of millions of metrics collected from tens of thousands of servers, virtual machines and network devices. Zabbix is Open Source and comes at no cost.
Zenoss Core
Website: https://ownit.zenoss.com/get-started.html
Cost: Free
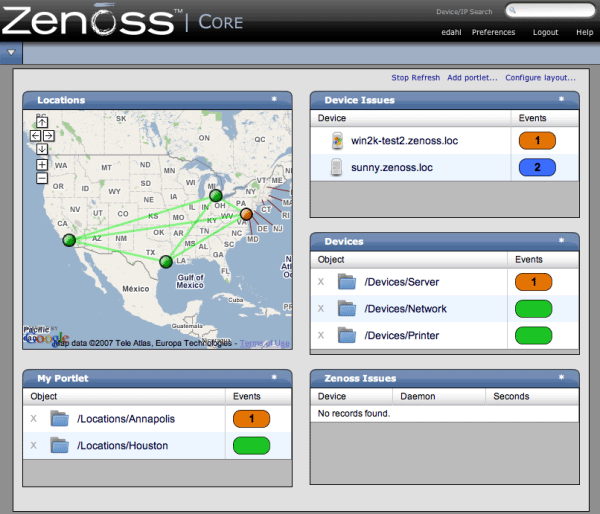
Zenoss is the ultimate unified monitoring platform, purpose-built specifically for modern IT infrastructures. We have a package to fit your needs whether you are a small business or enterprise.
PRTG Network Monitor
Website: https://www.paessler.com/prtg
Cost: Free and Paid Versions

PRTG monitors all systems, devices, traffic and applications of your IT infrastructure using these technologies:
- SNMP: ready to use and custom options
- WMI and Windows Performance Counters
- SSH: for Linux/Unix and MacOS systems
- Flows and Packet Sniffing
- Ping
- HTTP requests and push data
- SQL
- and many more
Everything you need is contained in one simple installer,
no additional downloads are required.
NeDi
Website: http://www.nedi.ch/
Cost: Free
Discover your network and find every end-node connected to it. Visualize the topology to get the big picture and find out where your assets are located. Check if your networking devices are alive or have been rebooted. Stay ahead of increasing traffic, drops, errors, failed links or replaced modules. Stay on top of the complete lifecycle from purchase to trade-in. Keep the configs organized and gain valuable insights for troubleshooting.
Splunk
Website: https://www.splunk.com/
Cost: Free Trial
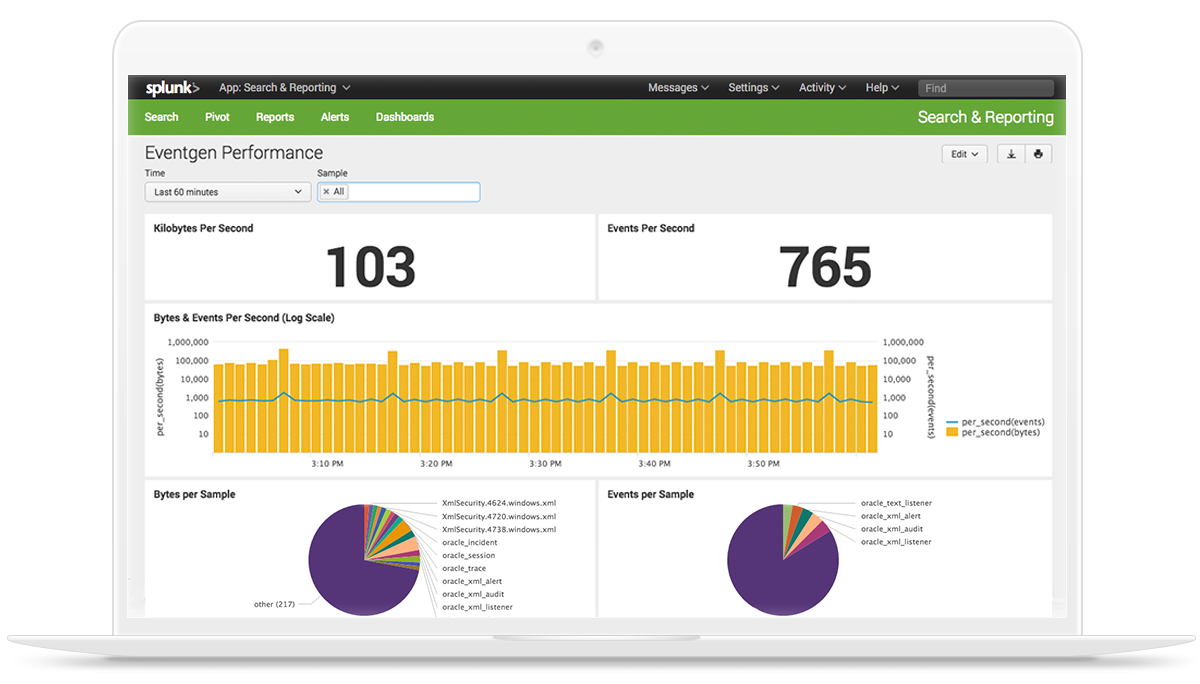
You see servers and devices, apps and logs, traffic and clouds. We see data—everywhere. Splunk®offers the leading platform for Operational Intelligence. It enables the curious to look closely at what others ignore—machine data—and find what others never see: insights that can help make your company more productive, profitable, competitive and secure. What can you do with Splunk?
Just ask.
Icinga
Website: https://www.icinga.com/
Cost: Free
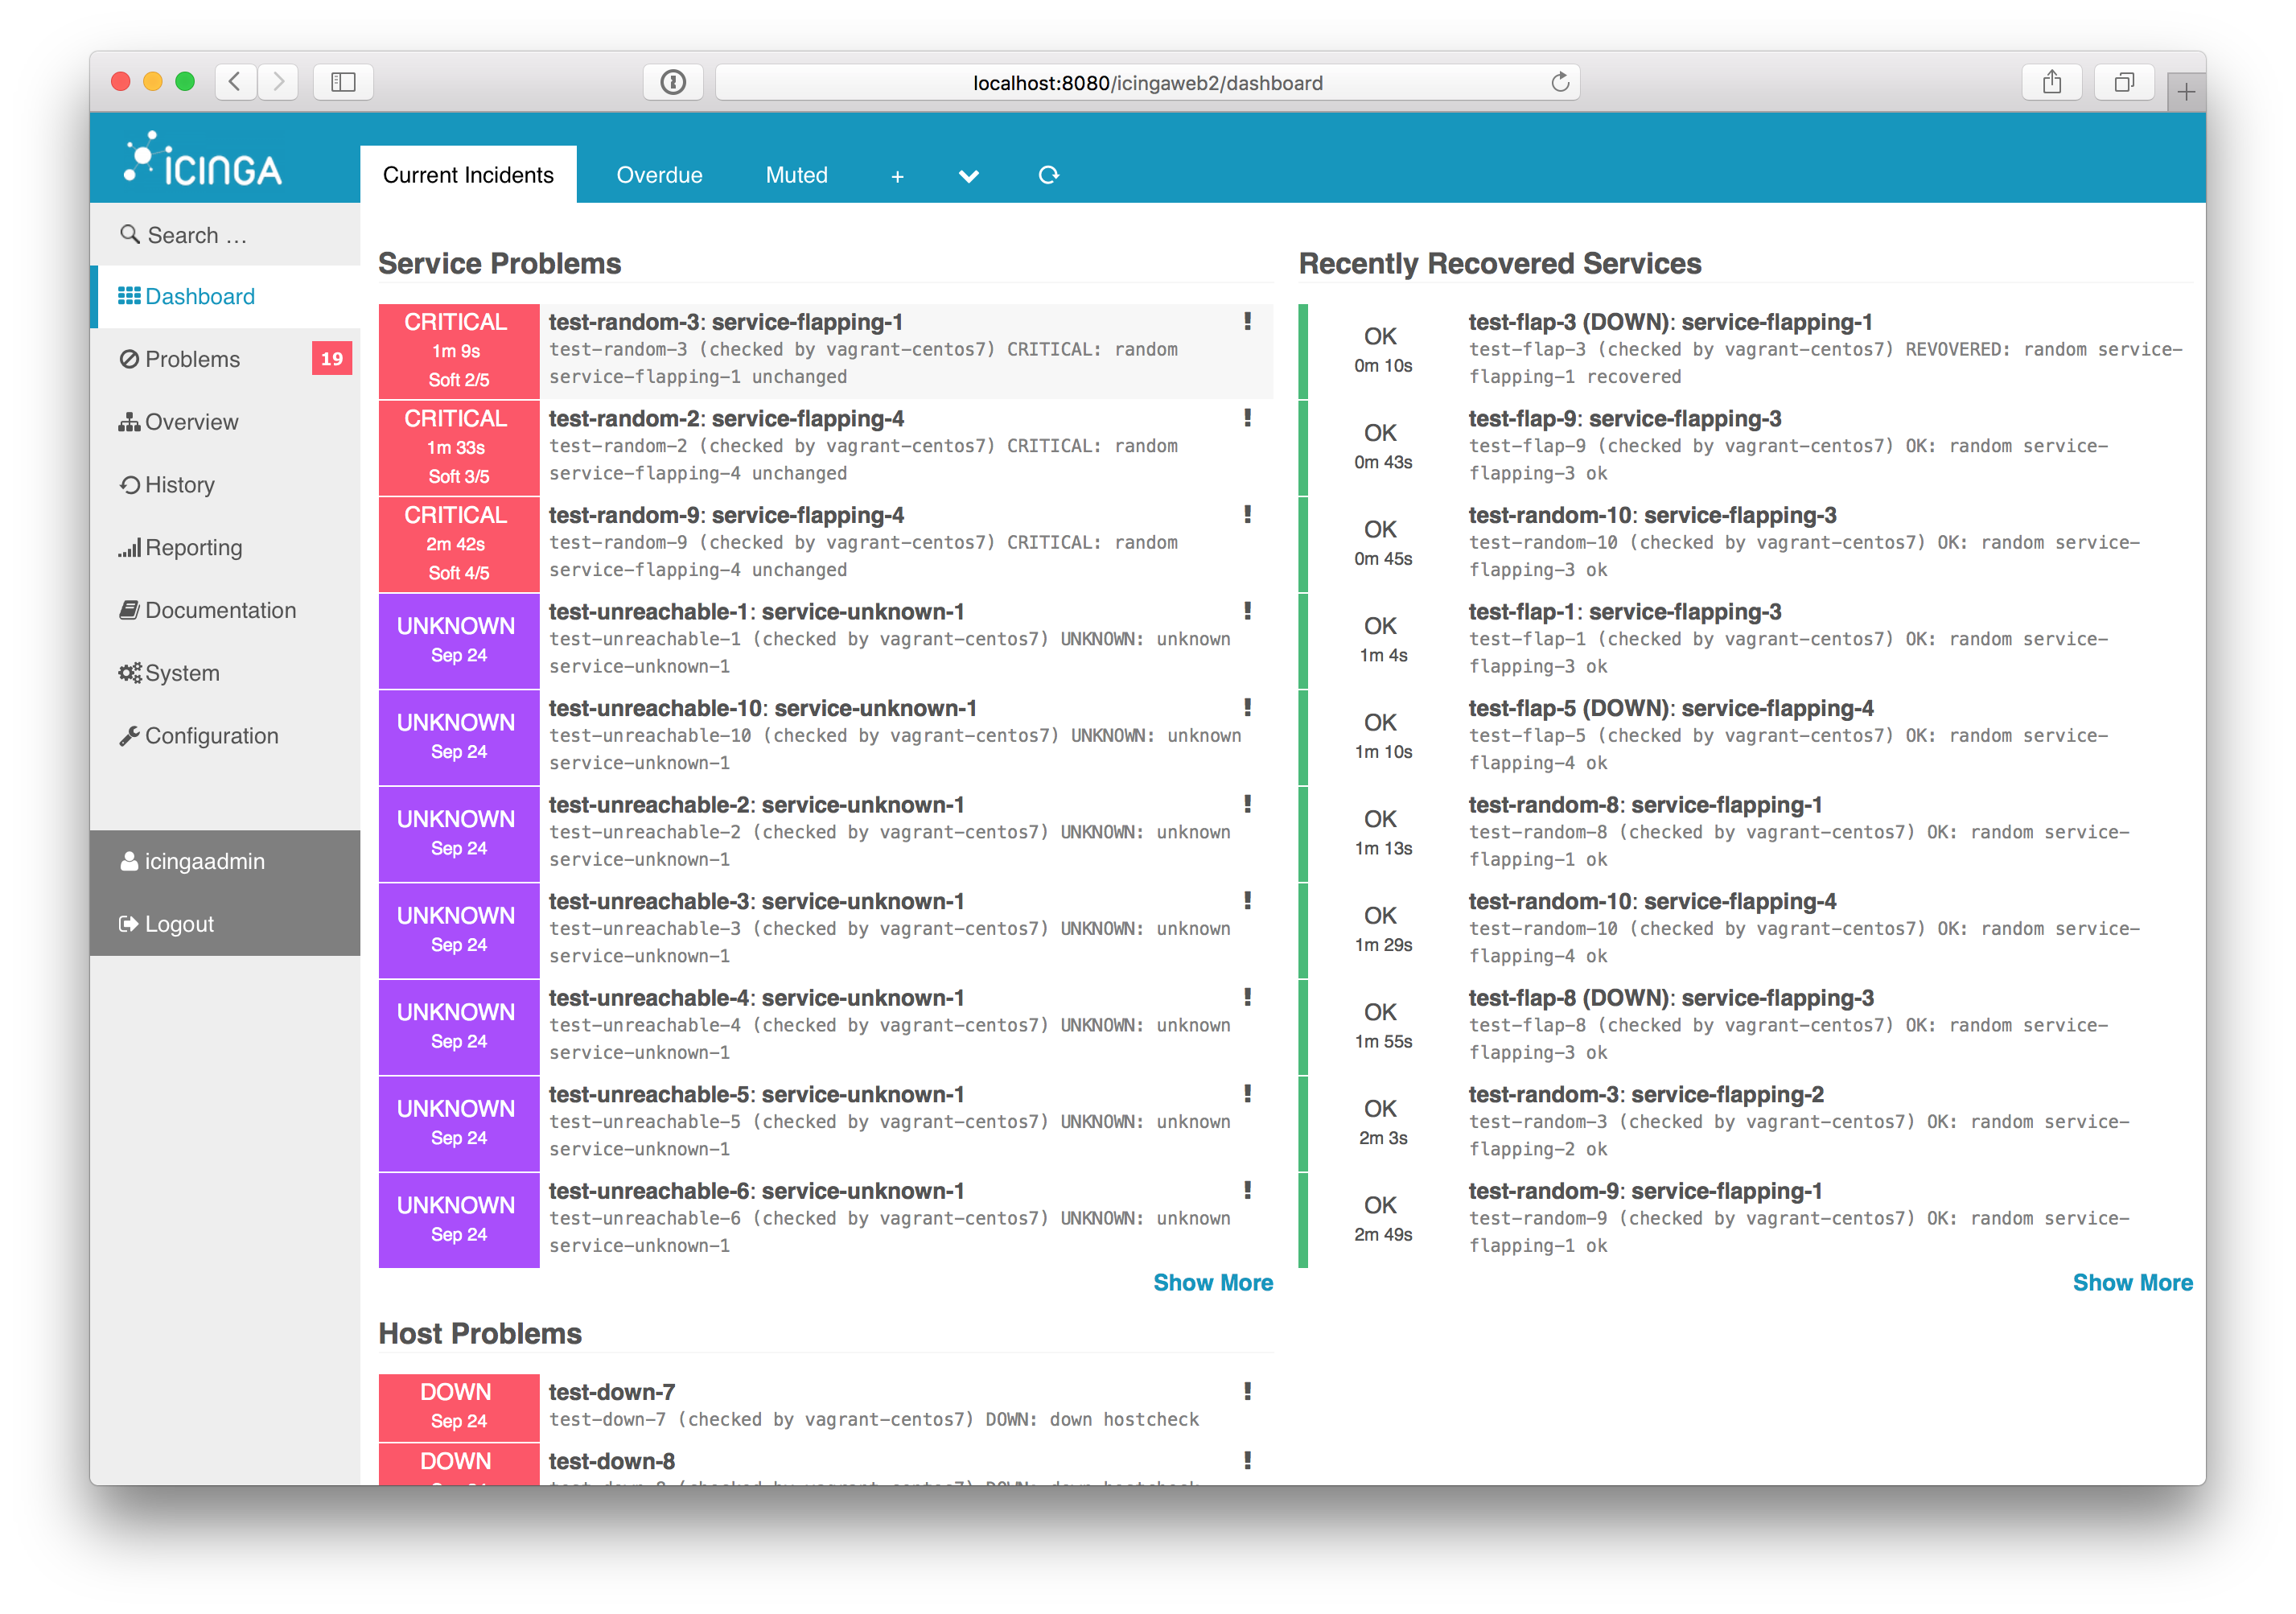
Icinga is a scalable and extensible monitoring system which checks the availability of your resources, notifies users of outages and provides extensive BI data.
NetSpot
Website: https://www.netspotapp.com/
Cost: Free
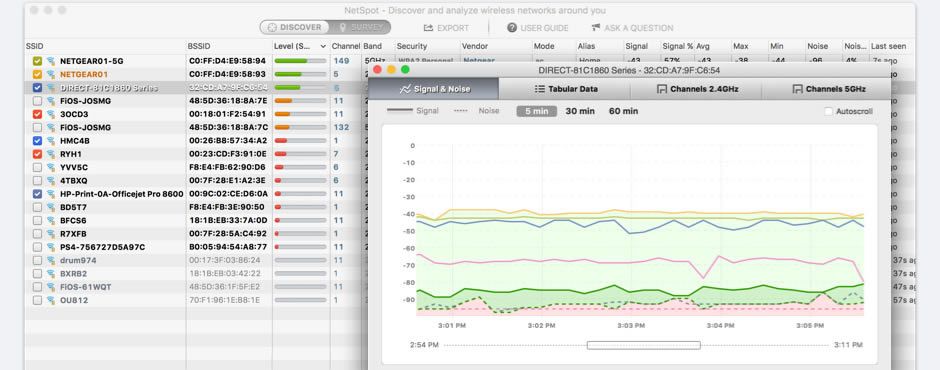
NetSpot is a professional app for wireless site surveys, Wi-Fi analysis, and troubleshooting on Mac OS X. It’s a FREE Wi-Fi analyzer. No need to be a network expert to improve your home or office Wi-Fi today! All you need is your MacBook running Mac OS X 10.6+ and NetSpot which works over any 802.11 network.
Ekahau Site Survey
Website: http://www.ekahau.com/wifidesign/ekahau-site-survey
Cost: Free Trial
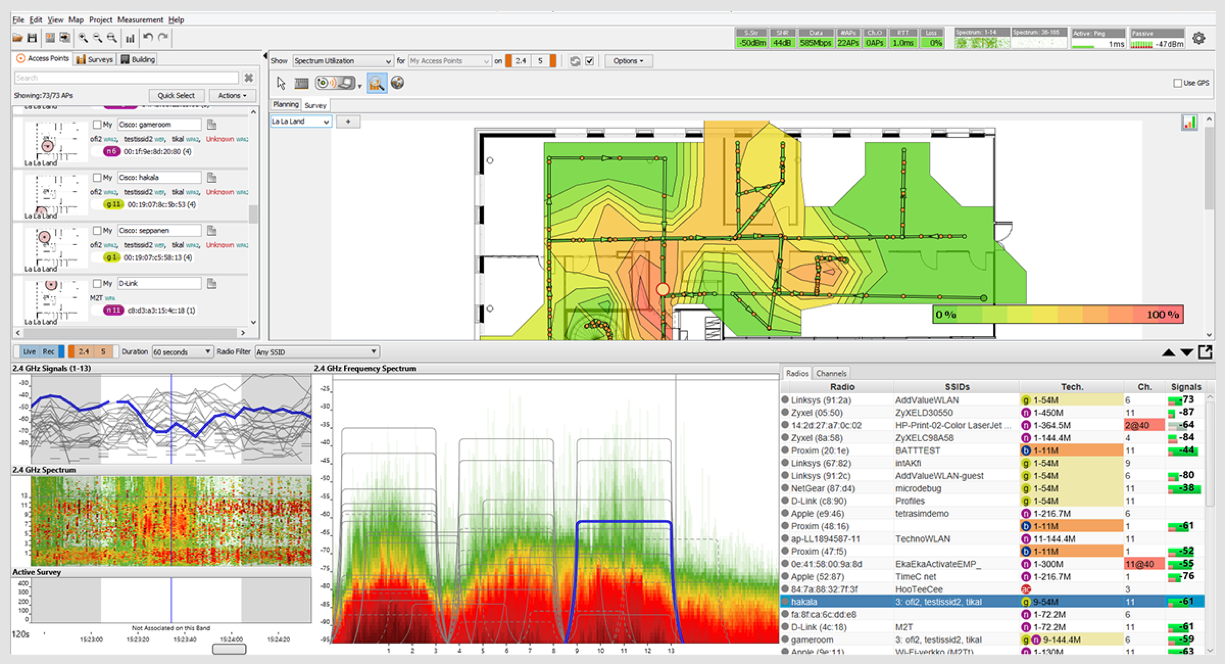
Over 12 years in the making, ESSTM maintains its reputation as the easiest to use, enterprise-grade Wi-Fi design and maintenance tool for Wi-Fi professionals. With crystal clear heat maps and easy-to-use reports, ESS makes it simple to optimize Wi-Fi. ESS allows you to plan and create Wi-Fi networks according to your performance and capacity requirements—taking into consideration the increasing amount of wireless clients and applications such as VoIP, HD video streaming and web browsing.
AirMagnet Wi-Fi Analyzer PRO
Website: http://enterprise.netscout.com/enterprise-network/wireless-network/AirMagnet-WiFi-Analyzer
Cost: Free Trial
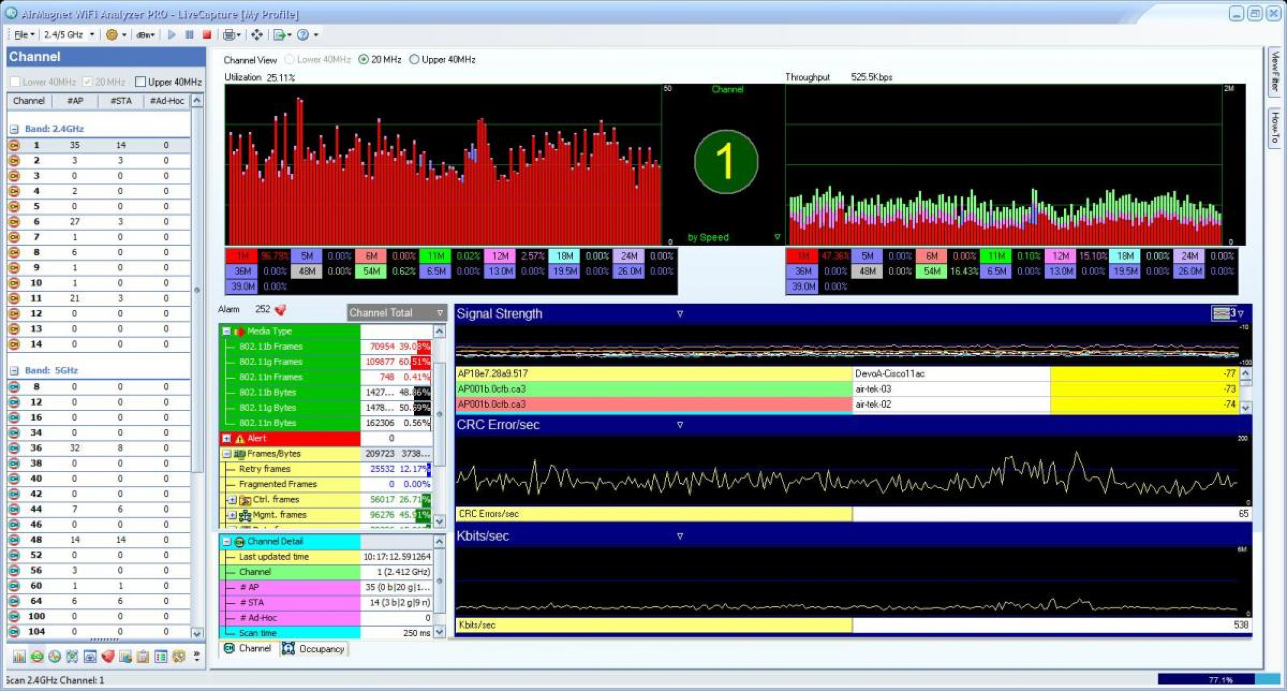
Wireless network monitor provides real-time accurate, independent and reliable Wi-Fi analysis of 802.11a/b/g/n and ac wireless networks, including 3 X 3 802.11ac wireless network analysis without missing any traffic . Highly portable wireless network analyzer that travels to the source of the wireless network troubleshooting problems enabling faster and accurate fault-finding without any AP downtime. Dedicated Wi-Fi network monitoring and troubleshooting software solution guaranteeing any wireless network fault detection as compared to “time-slicing monitoring functionality” built inside the wireless network infrastructure.
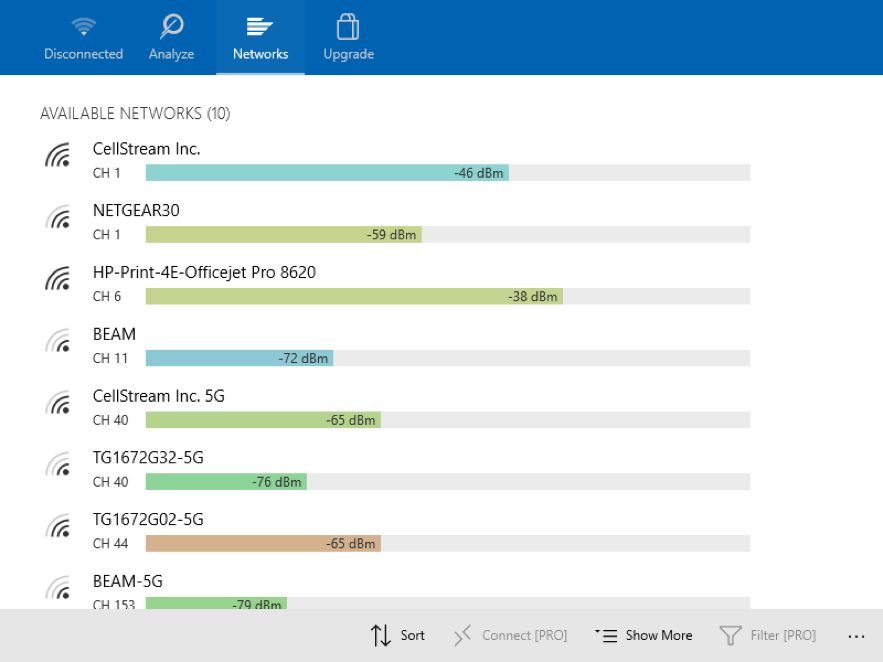
Windows 10 App – Wi-Fi Scanner
Website: https://www.microsoft.com/en-us/store/p/wifi-analyzer/9nblggh33n0n
Cost: Free
LinSSID – Linux Scanner
Website:
Cost: Free
LinSSID is a graphical and functional Wi-Fi scanner for Ubuntu Linux, which is similar to iwscanner and Inssider
Two step install from terminal window:
- sudo add-apt-repository ppa:wseverin/ppa
- sudo apt-get update; sudo apt-get install linssid
- Once installed, run it:
LinSSID is written from scratch entirely in C++ using Linux wireless tools and Qt4. It displays the information available from iwlist tool in graphical format. LinSSID displays a table of all of the local wireless networks that your device can receive, and information about them. It also displays charts of the signal strength of each network by channel number and over time. LinSSID will work with more than one wireless device attached to a system, but only one at a time (selectable). LinSSID requires root privilege to run the iwlist tool. So you’ll be prompt to input the user password when start the program from Unity Dash.
Xirrus WiFi Inspector
Website: https://www.xirrus.com/inspector/
Cost: Free Trial
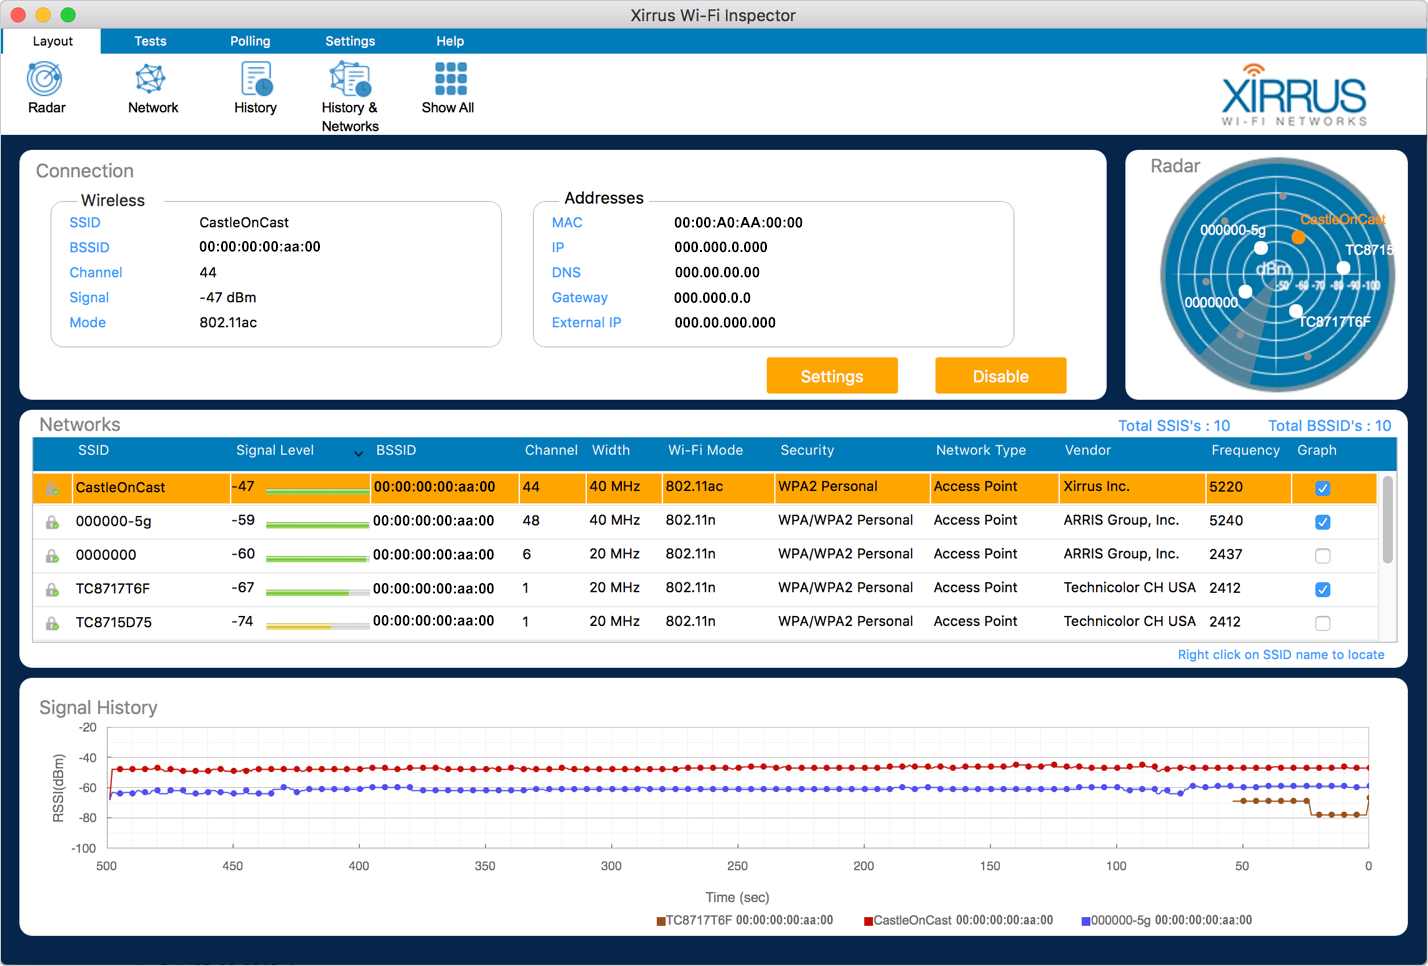
Wi-Fi Inspector has become the standard for helping organizations around the globe to quickly and easily gain visibility into their networks. This software is designed to provide real time monitoring of wireless network status, and help ensure you are getting the highest performance available from your wireless network. Wi-Fi Inspector 2.0 now operates on Windows and Mac OS X systems and supports the latest Wi-Fi standards, including 802.11ac Wave 1 and Wave 2 technology.
WirelessNetView
Website: http://www.nirsoft.net/utils/wireless_network_view.html
Cost: Free
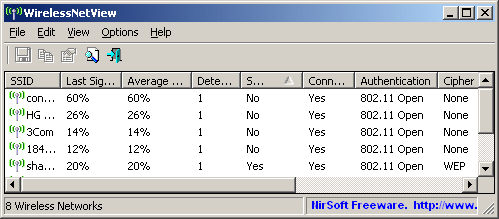
WirelessNetView is a small Windows only utility that runs in the background, and monitor the activity of wireless networks around you. For each detected network, it displays the following information: SSID, Last Signal Quality, Average Signal Quality, Detection Counter, Authentication Algorithm, Cipher Algorithm, MAC Address, RSSI, Channel Frequency, Channel Number, and more.
Wireshark
Website: https://www.wireshark.org/
Cost: Free
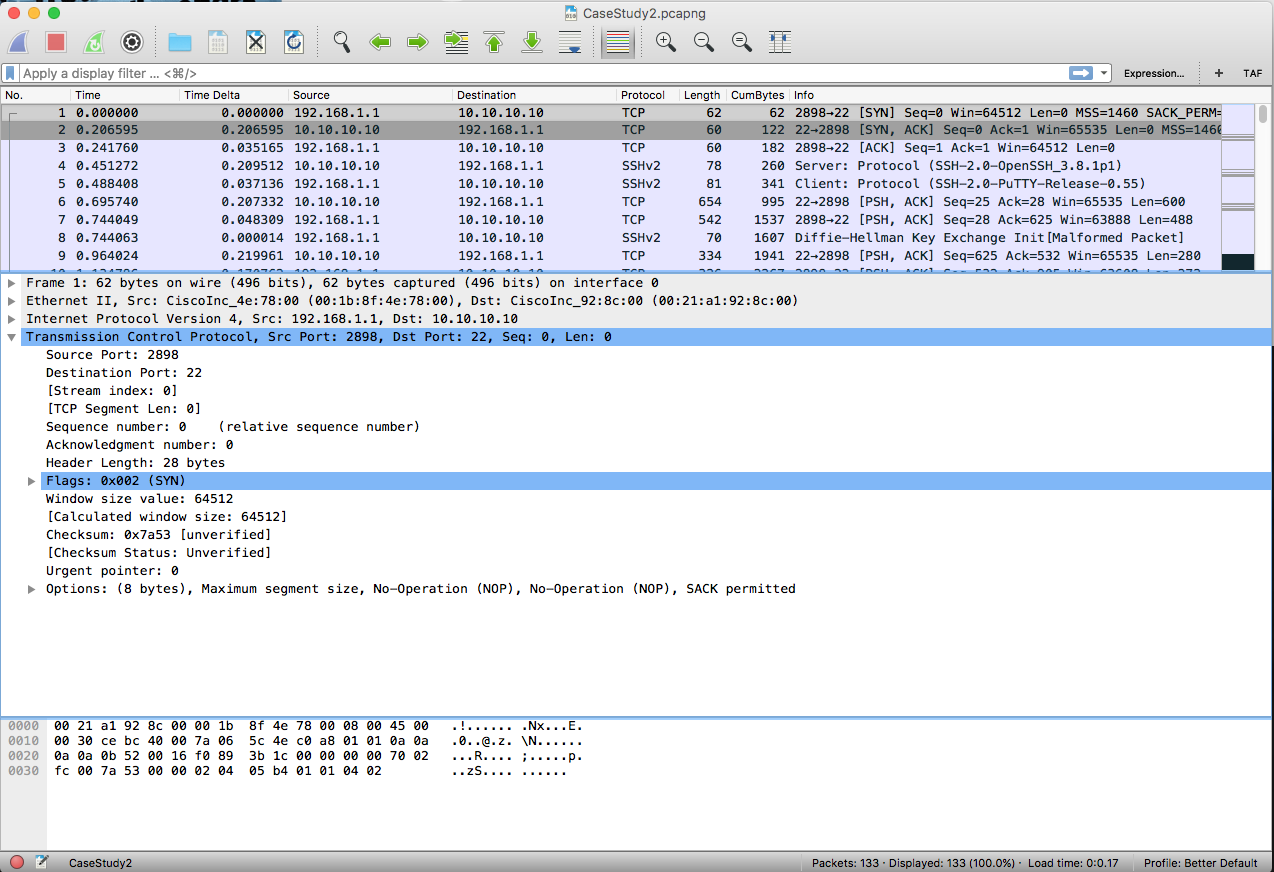
You all know how important this tool is and why it is on our list! Wireshark is the world’s foremost and widely-used network protocol analyzer. It lets you see what’s happening on your network at a microscopic level and is the de facto (and often de jure) standard across many commercial and non-profit enterprises, government agencies, and educational institutions. Wireshark development thrives thanks to the volunteer contributions of networking experts around the globe and is the continuation of a project started by Gerald Combs in 1998.
nmap/Zenmap
Website: https://nmap.org/download.html
Cost: Free
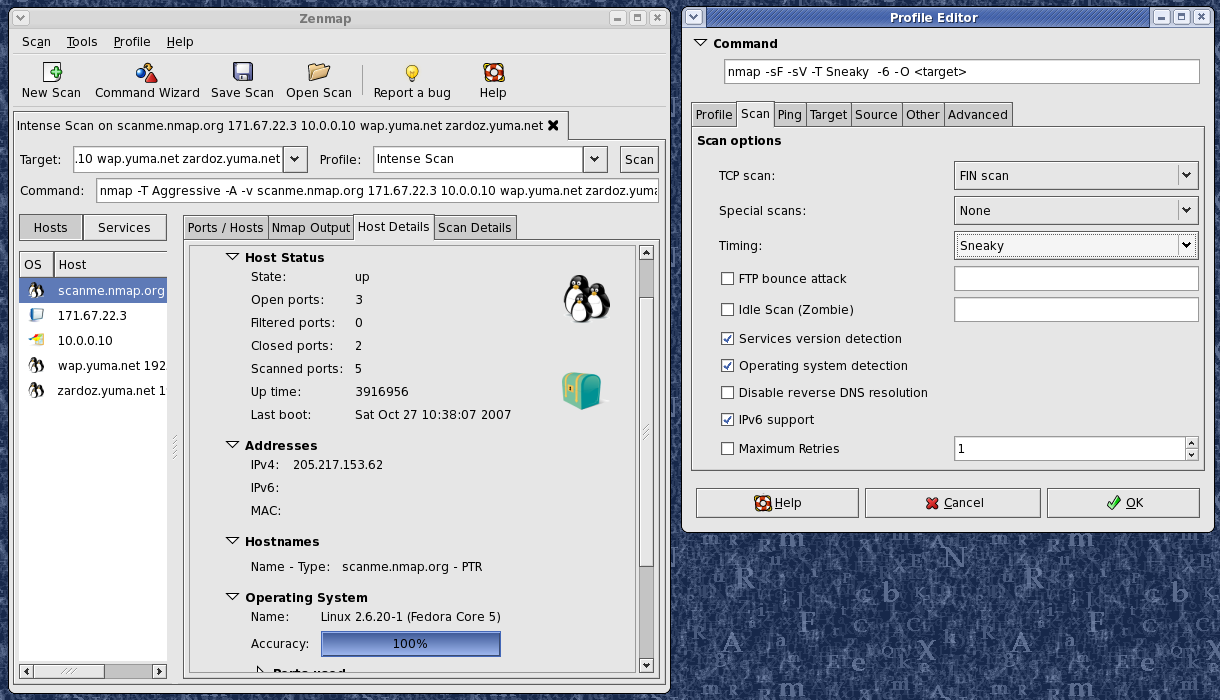
Nmap (“Network Mapper”) is a free and open source (license) utility for network discovery and security auditing. Many systems and network administrators also find it useful for tasks such as network inventory, managing service upgrade schedules, and monitoring host or service uptime. Nmap uses raw IP packets in novel ways to determine what hosts are available on the network, what services (application name and version) those hosts are offering, what operating systems (and OS versions) they are running, what type of packet filters/firewalls are in use, and dozens of other characteristics. It was designed to rapidly scan large networks, but works fine against single hosts. Nmap runs on all major computer operating systems, and official binary packages are available for Linux, Windows, and Mac OS X. In addition to the classic command-line Nmap executable, the Nmap suite includes an advanced GUI and results viewer (Zenmap), a flexible data transfer, redirection, and debugging tool (Ncat), a utility for comparing scan results (Ndiff), and a packet generation and response analysis tool (Nping). Nmap was named “Security Product of the Year” by Linux Journal, Info World, LinuxQuestions.Org, and Codetalker Digest. It was even featured in twelve movies, including The Matrix Reloaded, Die Hard 4, Girl With the Dragon Tattoo, and The Bourne Ultimatum.
Ansible
Website: https://www.ansible.com/
Cost: Free Trial
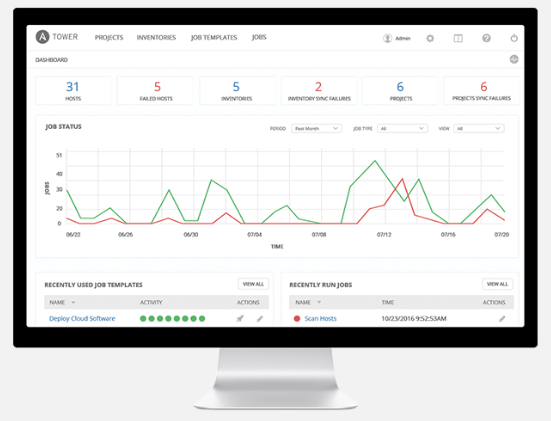
No one likes repetitive tasks. With Ansible, IT admins can begin automating away the drudgery from their daily tasks. Automation frees admins up to focus on efforts that help deliver more value to the business by speeding time to application delivery, and building on a culture of success. Ultimately, Ansible gives teams the one thing they can never get enough of: time. Allowing smart people to focus on smart things. Ansible is a simple automation language that can perfectly describe an IT application infrastructure. It’s easy-to-learn, self-documenting, and doesn’t require a grad-level computer science degree to read. Automation shouldn’t be more complex than the tasks it’s replacing.
Network Miner
Website: http://www.netresec.com/?page=NetworkMiner
Cost: Free and Paid
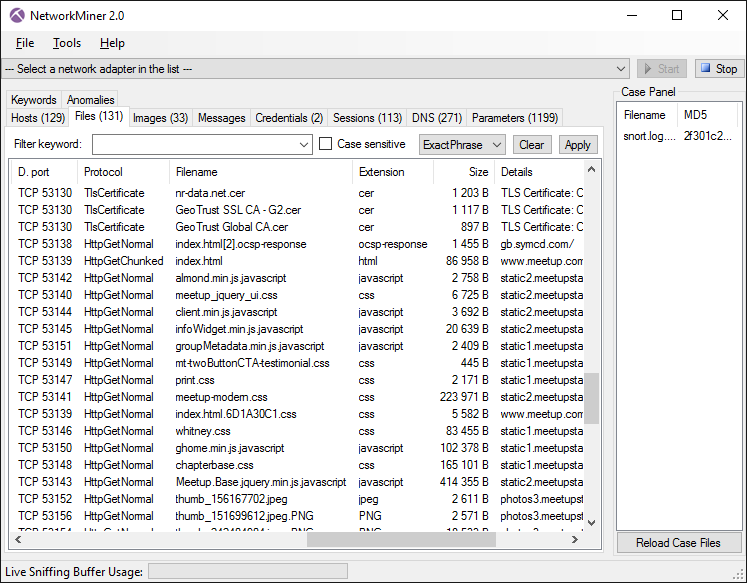
NetworkMiner is a Network Forensic Analysis Tool (NFAT) for Windows (but also works in Linux / Mac OS X / FreeBSD). NetworkMiner can be used as a passive network sniffer/packet capturing tool in order to detect operating systems, sessions, hostnames, open ports etc. without putting any traffic on the network. NetworkMiner can also parse PCAP files for off-line analysis and to regenerate/reassemble transmitted files and certificates from PCAP files. NetworkMiner makes it easy to perform advanced Network Traffic Analysis (NTA) by providing extracted artifacts in an intuitive user interface. The way data is presented not only makes the analysis simpler, it also saves valuable time for the analyst or forensic investigator. NetworkMiner has, since the first release in 2007, become a popular tool among incident response teams as well as law enforcement. NetworkMiner is today used by companies and organizations all over the world.
Colasoft’s Capsa Free Network Analyzer
Website: http://www.colasoft.com/capsa-free/
Cost: Free
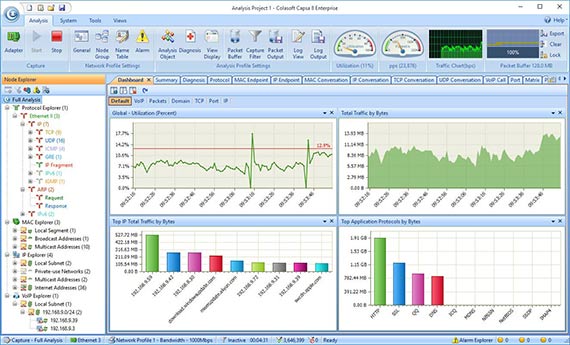
Along with tools like Colasoft’s MAC scanner and Packet Player we have this great tool. Capsa Free is a must-have freeware network analyzer for Ethernet monitoring, troubleshooting and analysis. It provides users with great experience to learn how to monitor network activities, pinpoint network problems, enhance network security and so on. Moreover, Capsa Free is a perfect choice for students, teachers and computer geeks to learn protocols and networking technology knowledge.
Microsoft Message Analyzer
Website: https://www.microsoft.com/en-us/download/details.aspx?id=44226
Cost: Free
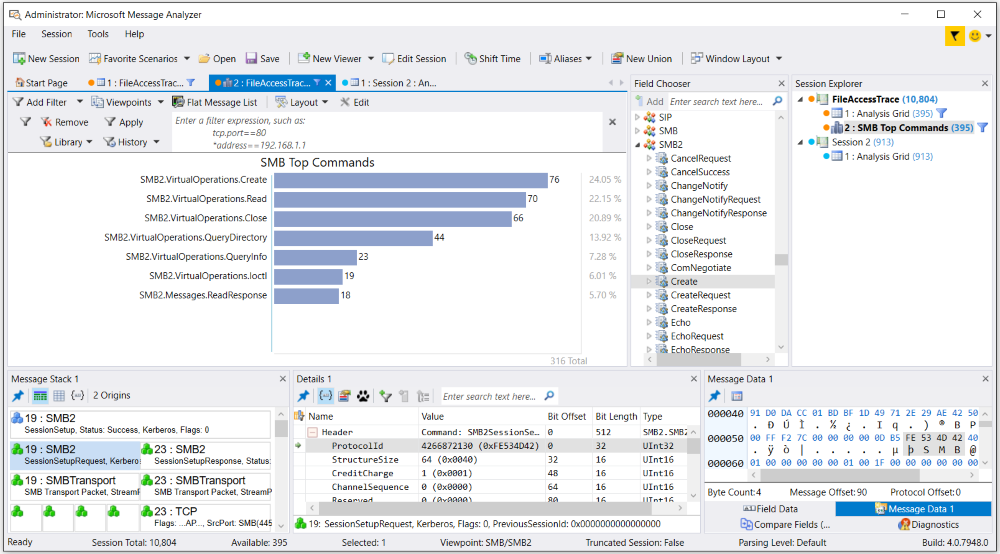
Message Analyzer enables you to capture, display, and analyze protocol messaging traffic; and to trace and assess system events and other messages from Windows components.
Ntop/Ntopng
Website: http://www.ntop.org/
Cost: Free
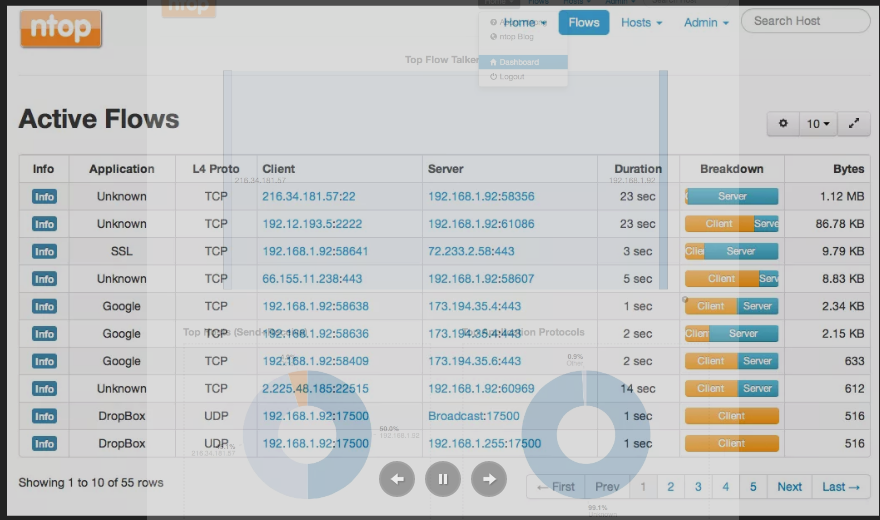
ntopng is the next generation version of the original ntop, a network traffic probe that shows the network usage, similar to what the popular top Unix command does. ntopng is based on libpcap and it has been written in a portable way in order to virtually run on every Unix platform, MacOSX and on Windows as well. ntopng users can use a a web browser to navigate through ntop (that acts as a web server) traffic information and get a dump of the network status. In the latter case, ntopng can be seen as a simple RMON-like agent with an embedded web interface. The use of:
- a web interface.
- limited configuration and administration via the web interface.
- reduced CPU and memory usage (they vary according to network size and traffic).
GFI LANGuard
Website: http://www.gfi.com/products-and-solutions/network-security-solutions/gfi-languard
Cost: Subscription
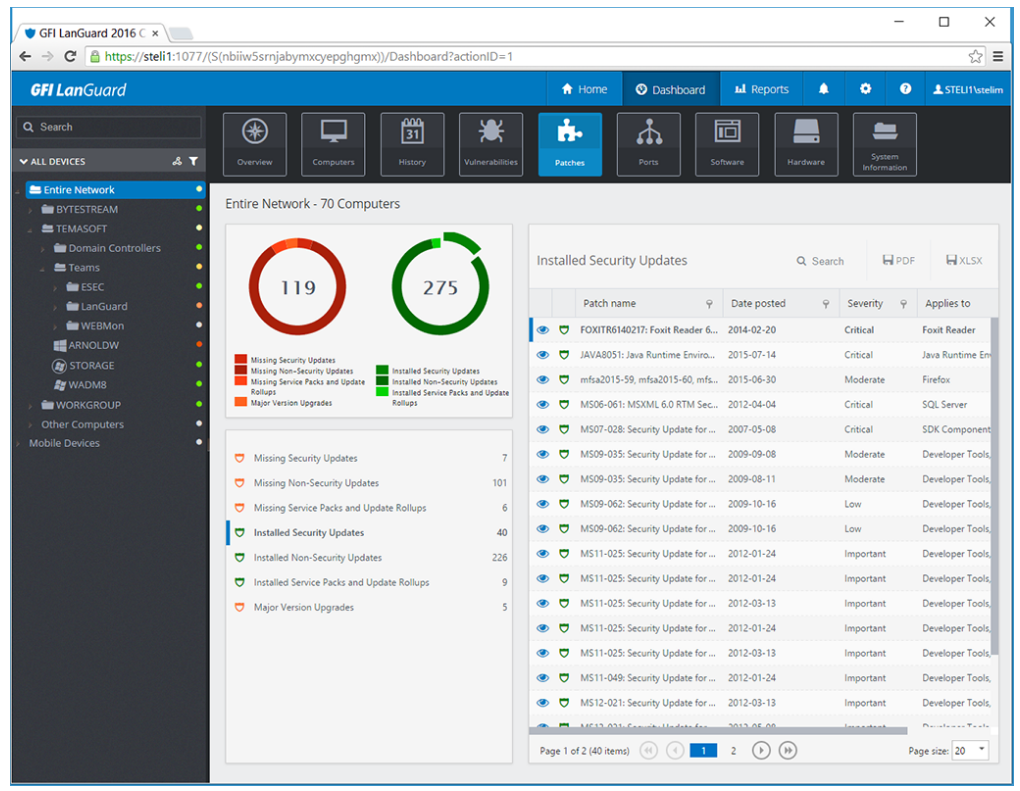
GFI LanGuard is a network security scanner and patch management tool that provides network mapping and risk analysis. You install the software on a single Windows machine, which then scans the network to discover all devices (servers, workstations, laptops, mobile devices, virtual machines, routers, switches, and printers) and interrogate them regarding security issues. Once discovered, the devices can be managed with or without an agent; using an agent will give IT administrators deeper results. While no security security tool is a silver bullet, GFI LanGuard is attractive because it’s notably more mature than many security tools popping on the market and so has a feature depth you won’t find in many other platforms.
Angry IP Scanner
Website: http://angryip.org/
Cost: Free
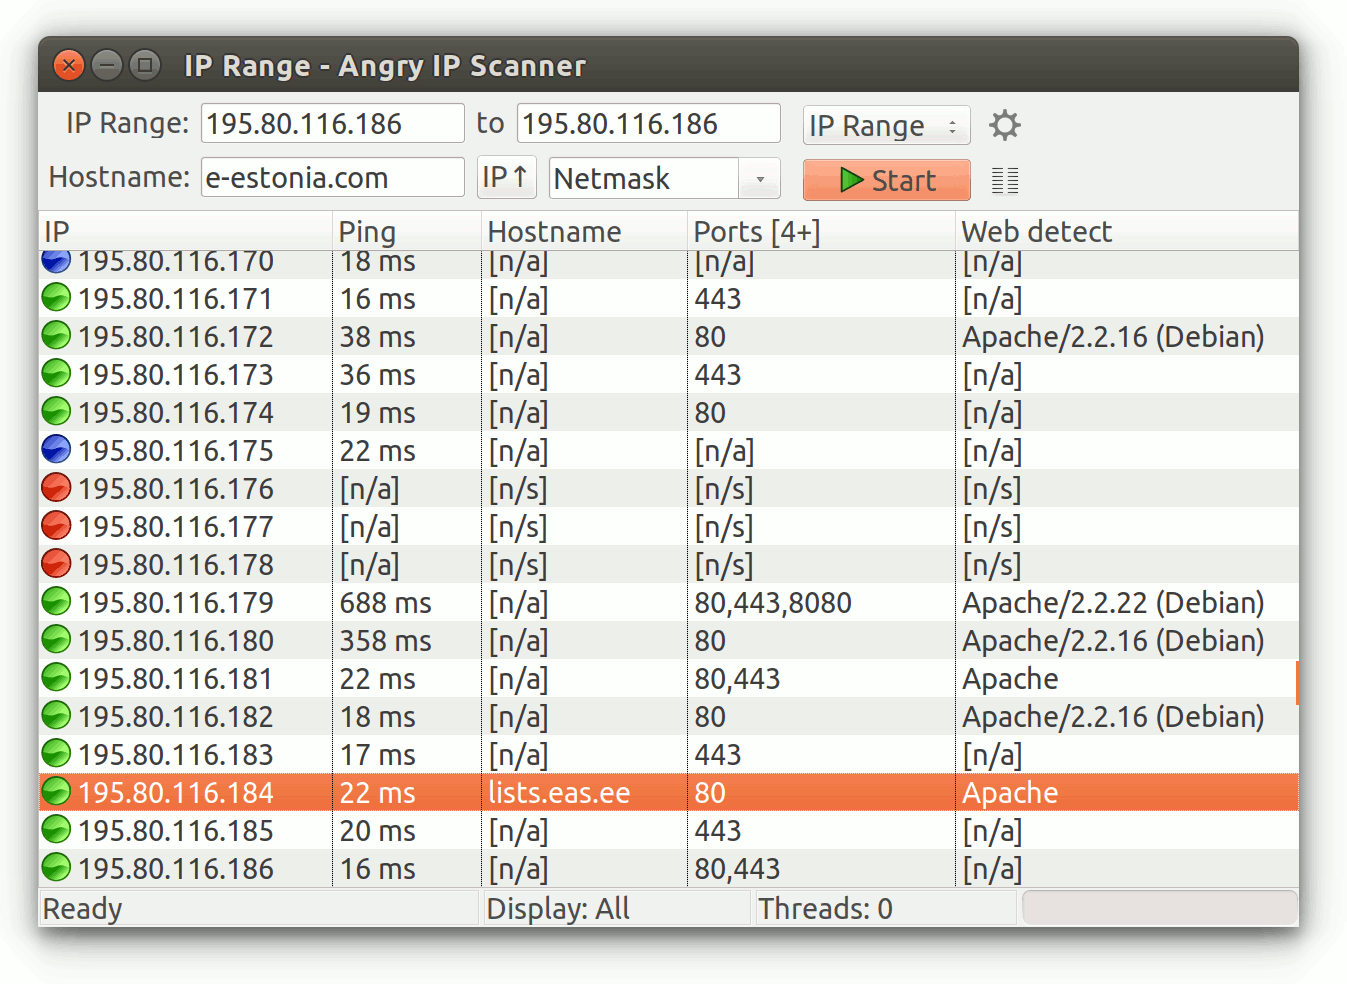
Angry IP scanner is a very fast IP address and port scanner. It can scan IP addresses in any range as well as any their ports. It is cross-platform and lightweight. Not requiring any installations, it can be freely copied and used anywhere.
Angry IP scanner simply pings each IP address to check if it’s alive, then optionally it is resolving its hostname, determines the MAC address, scans ports, etc. The amount of gathered data about each host can be extended with plugins.
It also has additional features, like NetBIOS information (computer name, workgroup name, and currently logged in Windows user), favorite IP address ranges, web server detection, customizable openers, etc. Scanning results can be saved to CSV, TXT, XML or IP-Port list files. With help of plugins, Angry IP Scanner can gather any information about scanned IPs. Anybody who can write Java code is able to write plugins and extend functionality of Angry IP Scanner.
Fiddler
Website: http://www.telerik.com/fiddler
Cost: Free Trial
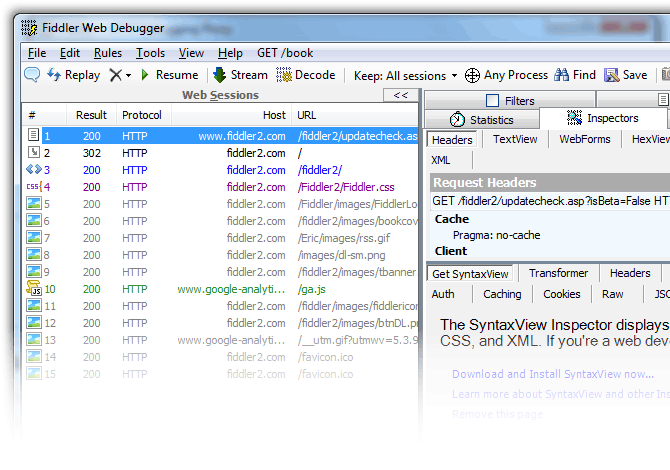
The free web debugging proxy for any browser, system or platform
Advanced IP Scanner
Website: http://www.advanced-ip-scanner.com/
Cost: Free
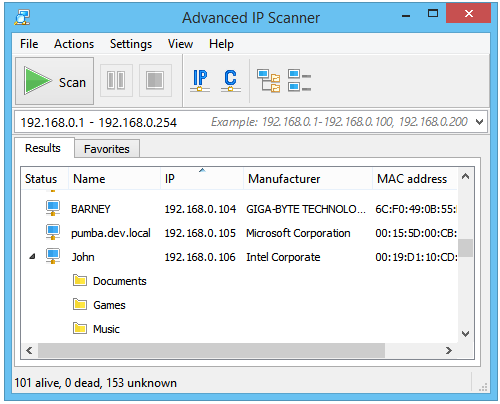
Reliable and free network scanner to analyze LAN. The program shows all network devices, gives you access to shared folders, provides remote control of computers (via RDP and Radmin), and can even remotely switch computers off. It is easy to use and runs as a portable edition. It should be the first choice for every network admin.
iPerf
Website: https://iperf.fr/
Cost: Free
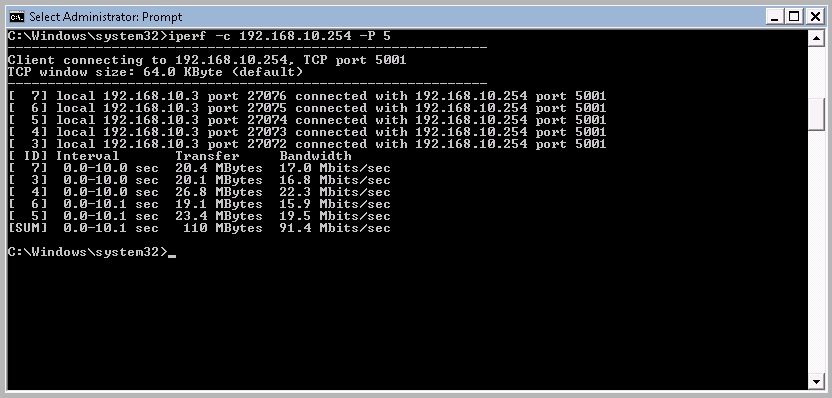
iPerf3 is a tool for active measurements of the maximum achievable bandwidth on IP networks. It supports tuning of various parameters related to timing, buffers and protocols (TCP, UDP, SCTP with IPv4 and IPv6). For each test it reports the bandwidth, loss, and other parameters. This is a new implementation that shares no code with the original iPerf and also is not backwards compatible. iPerf was originally developed by NLANR/DAST. iPerf3 is principally developed by ESnet / Lawrence Berkeley National Laboratory. It is released under a three-clause BSD license.
AI Engine
Web Site: https://bitbucket.org/camp0/aiengine
Cost: Free
AIEngine is a next generation interactive/programmable Python/Ruby/Java/Lua and Go network intrussion detection system engine with capabilities of learning without any human intervention, DNS domain classification, Spam detection, network collector, network forensics and many others.
AIEngine also helps network/security professionals to identify traffic and develop signatures for use them on NIDS, Firewalls, Traffic classifiers and so on.
I hope you have enjoyed this compilation.
If there are any I have missed, that you think should be added – please let me know!
I hope you find this article and its content helpful. Comments are welcomed below from registered users. You can also leave comments at our Discord server.
If you would like to see more content and articles like this, please support us by clicking the patron link where you will receive free bonus access to courses and more, or simply buying us a cup of coffee!
